

 28 November, 2016


The GDP numbers for a given year undergo a sequence of revisions based on data availability. The periodic revisions are meant to reveal the true picture of the economy, and affect macroeconomic forecasting and policymaking. Large, frequent, and uncertain data revisions can raise questions of data credibility and lead to imprecise inputs for policymaking. In this article, Sapre and Sengupta highlight several issues in the revisions in India's GDP series.
Gross domestic product (GDP) is one of the key macroeconomic aggregates used for assessing the economy’s growth performance and is also a vital input in policy formulation. Compilation of GDP is a complex exercise. It requires a combination of estimation methods and vast amounts of data from multiple sectors of the economy. Collection of detailed sectoral data is time consuming. Actual data on economic activities is not readily available for the computation of GDP estimates for any given year. In order to facilitate policymaking, preparation of annual budgets, and to provide a continuous assessment of the state of the economy to various stakeholders, several intermediate GDP estimates are computed. These intermediate estimates later get revised based on actual data availability.
In India, the Central Statistics Office (CSO) releases five estimates of annual GDP for any given year, over a period of two years and 10 months. The initial estimates (or projections) are called the Advance Estimates (AE) and Provisional Estimates (PE). Over time, the initial estimates are revised and are sequentially termed the First (1st RE), Second (2nd RE) and Third (3rd RE) Revised Estimates. Typically, for various stakeholders and for policy formulations, the initial GDP estimates are more relevant as they are available within the financial year. However, the true picture of the economy, in terms of the magnitude and direction of growth, unfolds over the entire revision cycle. It is thus important to study the revision cycle in order to obtain a detailed picture of growth in the economy. Studying revisions helps us to understand the methods, data sources, and the quality of GDP estimates in terms of reliability, credibility, and accuracy. On this premise, in recent research, we conduct a detailed study of historic revisions in India's annual GDP data, both at the aggregate and sectoral levels (Sapre and Sengupta 2017). Specifically, we ask two questions: (i) what has been the magnitude of revisions in GDP estimates at the aggregate and sectoral levels?; and (ii) how can we improve the predictability of the revisions for each sector? In order to assess predictability, we develop a method to construct a confidence band around the AE using standard deviation (SD)1 of revisions. We analyse whether the final revised estimate falls within a specific range. The analysis helps us to identify sectors with large and unpredictable revisions in growth rates.
Process of GDP data revisions
In the cycle of revisions, the first step is to produce the AE of aggregate and sectoral GDP. The AE uses 7-8 months of data on high-frequency indicators that are assumed to capture the level of economic activity in each sector. The PE is the first full-year estimate as it is based on 12 months of data on all the representative sectoral indicators. The 1st, 2nd and 3rd REs are further revisions based on availability of data from actual expenditure figures in government budgets and finalisation of government accounts. The 3rd RE is considered as the final estimate of the year, available after a lag of two years and 10 months.
In the literature on GDP revisions, scholars have argued that data revisions contain both 'news' and 'noise' about the economy's growth performance (see, for instance, Mankiw and Shapiro (1986), Fixler et al. (2008)). This view is based on the fact that as AEs are compiled with incomplete data or proxies based on high-frequency indicators, there is likely to be more noise in these estimates. Gradually with more data availability, the extent of noise is expected to diminish, and the revised estimates start to reflect 'news' about the state of the economy. In the Indian context, this process can be visualised in the following figure.
Figure 1. Timeline of GDP data revisions: From noise to news
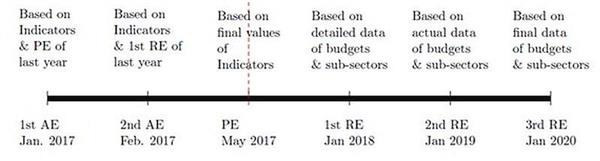 Source: Sapre and Sengupta (2017)
 What do we know from studying revisions?
We study revisions in aggregate GDP and its sub-sectors at constant prices. Table 1 shows the revisions in growth rate of GDP over the entire revision cycle.
Table 1. Revisions in annual growth rate (%) of GDP at Factor
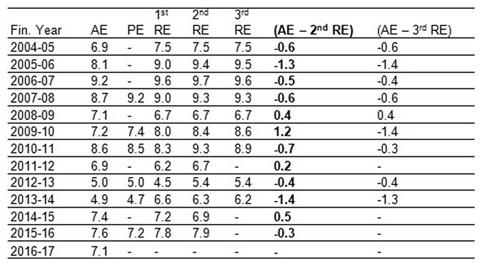 Notes: (i) Compiled from various press releases of annual estimates of GDP and various releases of National Account Statistics (NAS) (ii) Figures for 2015-16 and 2016-17 are from the 2011-12 series of NAS, the remaining are from the 2004-05 series of NAS. (iii) All the figures are in percentages.
 The magnitude of revisions in annual GDP growth rates from the initial to the final estimate has, in general, been low. However, the direction in revisions suggests that for most years, the AE underestimated the actual GDP growth rate. The growth rate was almost always revised upwards in subsequent rounds thereby hinting at a downward bias. The figures also suggest that in most years the 2nd and 3rd RE have been close and consistently in one direction. This implies that the focus of improving data revisions needs to be on the AE as the discrepancy is much larger in these initial estimates.
Sector-wise GDP revisions tell a different story. Following international practice, we divide the revisions into short term (AE – 1st RE) and long term (AE – 2nd RE). We find that for manufacturing, mining, trade, and community services, the short-term revisions on average, have been negative, implying that the initial projections of the sectors were underestimates. In contrast, when we compare long-term revisions (AE – 2nd RE), we find a reverse phenomenon for sectors such as electricity, construction, and financial services. Agriculture and trade are the only sectors where the short-term and long-term revisions have been in the same direction. Among all sectors, mining and quarrying shows the highest variability in long-term revisions. Table 2 summarises the revisions for all sectors.
Table 2. Revisions in annual growth rate (%) of sectors by economic activity, 2004-05 & 2011-12 series, Constant Prices
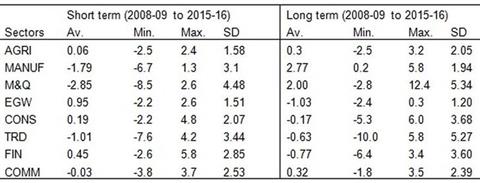
Short term denotes (AE – 1st RE) and long term denotes (AE – 2nd RE). The figures are from the 2004-05 series till 2013-14, and 2011-12 series for the last two years. AGRI is agriculture, fishing and forestry; MANUF is manufacturing; M&Q is mining & quarrying; EGW is electricity, gas and water supply; CONST is construction; TRD is trade and transport; FIN is financing, insurance, real estate and business services; COMM is community, social, and personal services.
There are two main takeaways from the analysis. First, the extent of revisions both at the aggregate and sectoral levels has not reduced over time. Second, the magnitude and direction of revisions remains unpredictable at the sectoral level.
We next construct confidence bands for each sector as it allows us to obtain a range around the AE. The band is constructed by using 1 SD of revisions to compute upper and lower bounds around the AE. To assess predictability, we count the number of times the final estimate falls within the confidence band for each sector. We find that the confidence band is accurate for all years for the electricity, gas, and water supply sector, while the accuracy is 70% in case of agriculture, construction, trade, financial services, and community services sector. The predictability is lowest at 57% for the manufacturing, and mining and quarrying sectors.
Conclusion
Revisions in GDP data have important implications for policy formulations and business decisions of different stakeholders. While AE of GDP may be important for macroeconomic assessment, understanding the process of revisions is equally important to draw meaningful conclusions about the growth performance of the economy. The revision cycle helps us to distinguish between data changes and genuine macroeconomic fluctuations. However, revisions have their own share of problems. Large and unpredictable revisions raise concerns over data reliability. In the context of revisions in Indian GDP, the need of the hour is to focus on data quality and improved coverage of sectors so as to contain the magnitude of revisions. In keeping with international best practices, a systematic analysis of the historic revisions using quality assessment metrics is also required. It is equally important to review the choice of high-frequency indicators that are used to compile the AE, in order to improve the accuracy of the data revisions.
Note:
- Standard deviation is a measure that is used to quantify the amount of variation or dispersion of a set of values from the mean value (average) of that set.
Further Reading
- CSO (2012), ‘National Accounts Statistics: Sources and Methods’, Central Statistics Office, Ministry of Statistics and Programme Implementation, Government of India.
- CSO (2016), ‘Statement on release calendar of annual and quarterly estimates of GDP and policy of revision of annual & quarterly estimates of GDP and related macro-economic aggregates’, Press Release, Ministry of Statistics and Programme Implementation, Government of India.
- Fixler, Dennis J and Bruce T Grimm (2008), “The Reliability of the GDP and GDI Estimates”, Survey of Current Business, February 2008.
- Mankiw, N Gregory and Matthew D Shapiro (1986), “News or Noise: An Analysis of GNP Revisions”, Survey of Current Business, May (66):20-25.
- Sapre, A and R Sengupta (2017), ‘An analysis of revisions in Indian GDP data’, National Institute of Public Finance and Policy (NIPFP), Working Paper No. 213, New Delhi.

Comments will be held for moderation. Your contact information will not be made public.