

 07 July, 2020


Since the deregulation and privatisation reforms of the early 1990s, Indian banking has witnessed many significant changes. This article finds that the sector experienced steady productivity growth until 2010-11. However, instead of getting passed on to the broader economy, these gains have accrued to the owners, which, for 70% of the sector, is the government, and in turn, are potentially used to bail-out defaulting borrowers.
The banking sector is a significant pillar of the Indian economy and is the cornerstone of financial intermediation. Since the deregulation and privatisation reforms of the early 1990s, Indian banking has witnessed many significant changes, such as the rapid growth of privately owned banks, gradual penetration of information technology in all strata of banking, improved risk-management practices, etc. These changes would have important implications for the productivity of the banking sector.
One parameter that demonstrates these gains is employment in banking. Between 1991 and 2010, despite growing at over 15%, Indian banking did not add to net employment. It employed about the same number of people in 2010 as it did in 1991. In fact, employment fell across both private- and public-sector banks between 2000 and 2009. Yet during this period, the banking-sector balance sheet grew by 25%. Balance sheet per employee grew phenomenally between mid-1990s and 2010. This hints at dramatic improvements in productivity.
Figure 1. Cost of intermediation of the Indian banking system, 1992-2019
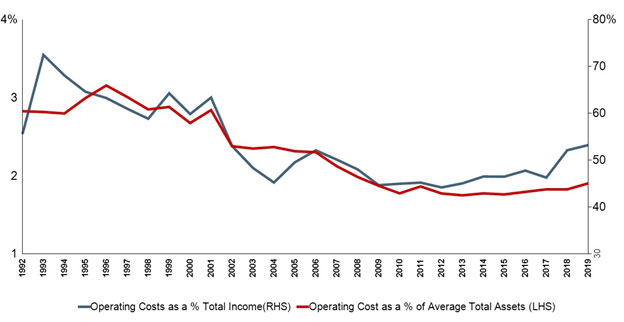
Source: Reserve Bank of India (RBI); Authors’ analysis.
Another indicator of productivity growth is consistent reduction in costs. Banks, as financial intermediaries between savers and borrowers, incur costs in transforming savings into credit. The cost of intermediation mainly consists of costs of operations of the banking system, that is, costs of manpower and establishment, and other items, such as information technology-related costs. The cost of intermediation must come down for the system to enjoy productivity gains.
As shown in Figure 1, operating costs as percentage of total assets and as a percentage of total income began declining from mid-1990s onwards, implying substantial productivity gains. Since roughly 2010 however, it appears that productivity growth in the overall banking sector has slowed down and may have even stalled.
In new research (Sengupta and Vardhan 2020), we throw some light on who have been the main beneficiaries of these efficiency gains witnessed by the Indian banking sector during the period from mid-1990s to 2010.
The four main stakeholders who can benefit from productivity gains in banking are employees, depositors, borrowers, and shareholders. It is likely that parts of the gains accrued to all these classes of claimants. We try to assess how much each of these stakeholders benefitted from the gains.
Beneficiaries of productivity gains
Depositors
Indian commercial banks offer three types of deposits: (i) demand deposits (commonly known as current account deposits; similar to checking accounts in the US), (ii) savings account deposits, and (iii) term deposits (also known as fixed deposits). Of these, demand deposits do not carry any interest. Until 2012, interest rate on savings account deposits (accounting for roughly 25-30% of a bank's deposit base) was regulated by the government at 4%. Even after deregulation most banks adhered to the old levels of 4%. Only the term deposits are priced based on market conditions, and their pricing reflects prevailing interest rates and competitive dynamics in the deposit business.
Figure 2. Term-deposit pricing relative to risk-free government security yield
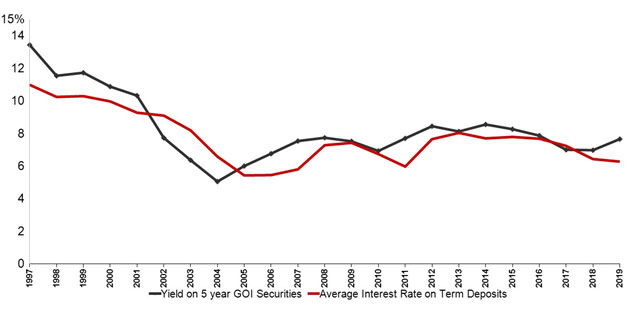
Source: RBI; Authors’ Analysis.
Note: GOI refers to the Government of India.
This implies that if the depositors benefitted from productivity gains, we would expect the term-deposit pricing to improve over time relative to a suitable reference rate. Accordingly, we plot the annual average interest rate on term deposits and the five-year government security (G-Sec) yield from 1997 to 2019 in Figure 2.
We find that during the period of study, especially during the mid-1990s to 2010 when the banking sector experienced productivity growth, there was no appreciable improvement in the term-deposit pricing relative to the risk-free reference rate, that is, the G-Sec yield. This suggests that depositors may not have received any appreciable part of the productivity gains. Average term deposit has been priced during this period at a discount of around 50 to 70 basis points, and the discount has stayed in the same range. Only exception was the period between 2001 and 2004 when the deposits were priced at premium to the reference yield. If we look at the same data across the various groups of banks, we see no perceptible differences in deposit pricing.
Borrowers
Bank borrowers are important stakeholders in the banking business and rightful claimants to productivity gains. As in the case of the depositors, any sharing of productivity gains by the borrowers should get reflected in the pricing of loans. Loan prices should decline relative to an appropriate reference rate. In Figure 3, we plot the average yield on loans for all banks and the 10-year G-Sec yield for the period from 1997 to 2019.
Figure 3. Average loan pricing relative to risk-free government security yield
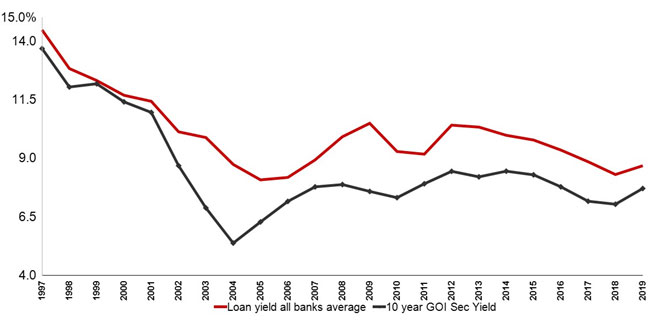
The figure shows that the loan prices have not declined relative to the G-Sec rate and in fact, the loan pricing premium over the risk-free reference rate has been more or less constant from 2005 onwards. This suggests that as in the case of depositors, the borrowers too may not have received any share of the productivity gains enjoyed by the banking system1.
Employees
The next stakeholders that we consider are employees. Employee costs (wages and salaries) are a component of the overall cost of intermediation. Hence, productivity growth measured as a reduction in the cost of intermediation would imply that employee costs would come down, but the important question is, by how much on a relative scale. In Figure 4, we plot the employee costs for the banking system as a percentage of average total assets and total income.
Figure 4. Employee costs as a percentage of total assets and income, 1992-2019
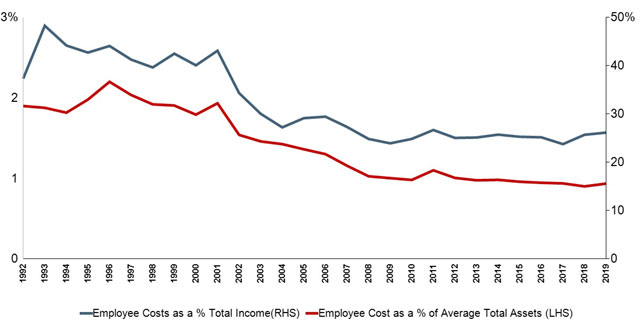
We find that there has been a secular decline in employee costs during the period under review. Employee costs have come down largely because the number of employees declined between 1991 and 2010. To evaluate the possible share of employees in productivity gains of the banking system, we plot the real per-employee wage cost relative to the growth in real balance sheet of the entire banking sector from 1992 to 2019 in Figure 5. Our hypothesis is that if the employees had shared some productivity gains, the total wage bill would come down but the per employee real (or nominal) wages would improve by at least as much as the growth in banking income or assets, if not by more.
Figure 5. Real per-employee compensation, and total balance sheet of the banking system, 1992-2019
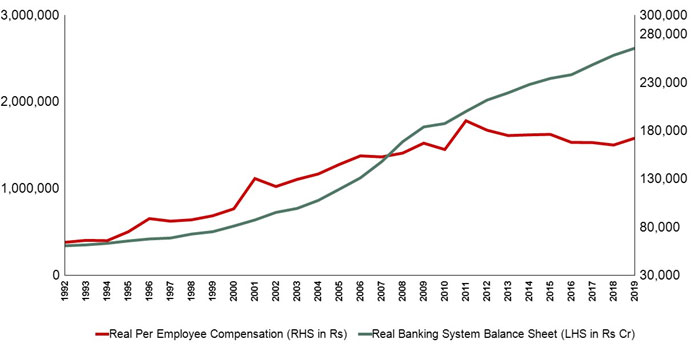
The figure shows that during 1992-2019, the growth in real per employee wages has lagged behind the growth in banking-sector balance sheet. The compounded annual growth rate (CAGR) of real per employee compensation during this period was 3.6%, whereas the growth in real balance sheet of the banking system was 7.7%. The CAGR in real wages was faster from 1992 to 2007 at 5.9% when the real balance sheet grew at 9.4%. From 2007 to 2019, the real per employee wages have been almost stagnant, growing at only 0.7% annually when the real balance sheet grew at 4.9%.
This suggests that employees do not appear to have benefitted from the productivity gains, given their wage growth has been consistently lower than the growth in banking business, and has been almost stagnant for the past 12 years or so.
Shareholders
The last stakeholders we consider are shareholders of the banks. For the public-sector banks (PSBs), the majority owner is the government which, by law, has to maintain at least 51% ownership in these banks. For private banks, the ownerships tends to be widely distributed as the current regulations limit any individual or entity to a 5% ownership (which can go up to 10% with special approval of the regulator). Most foreign banks operate in India as branches of the parent international banks.
Figure 6. Operating costs and pre-provisioning operating profits (PPOP) as a % of average assets of the banking system, 1993-2019
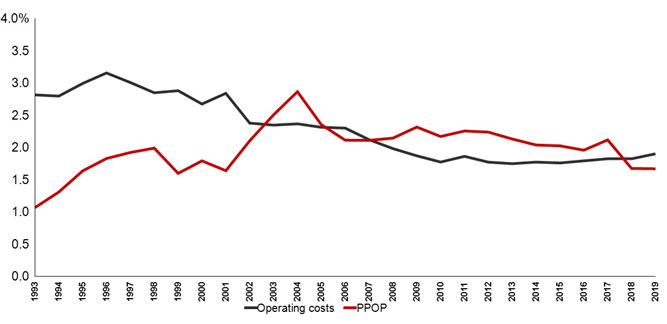
Figure 6 depicts the pre-provisioning operating profits (PPOP) of the banking system and the cost of intermediation. PPOP, also referred to as operating profit is the profit before risk-related provisioning, and hence measures the gains to the shareholders before paying for risk. The operating cost of the banking system has been declining during the first part of the period under review. The productivity gains added to PPOP until about 2007, and then operating profits stagnated as there were negligible gains in productivity from then on. The evolution of these two parameters therefore suggests that the cost of intermediation saved by the banks went directly into the operating profits, implying that it accrued to the shareholders.
Among other uses, increases in PPOP are utilised to make provision for the credit losses (losses on non-performing loans) that banks incur. After providing for these losses, paying taxes, and paying dividend to shareholders (if any), the residual profits add to the capital base of the bank. In order to understand the pattern of use of the gains in PPOP towards credit-loss provisioning, ideally we would like to look at the data on credit loss provisioning over the same time period. Unfortunately, this data are not available on a consistent basis.
Hence, we look the level of non-performing assets (NPAs) of the banks which would be a crucial determinant of the credit-loss provisioning needed. For this, we analyse the government owned banks (PSBs and SBI (State Bank of India) group together) here. In our study, we have also analysed the private banks and foreign banks.
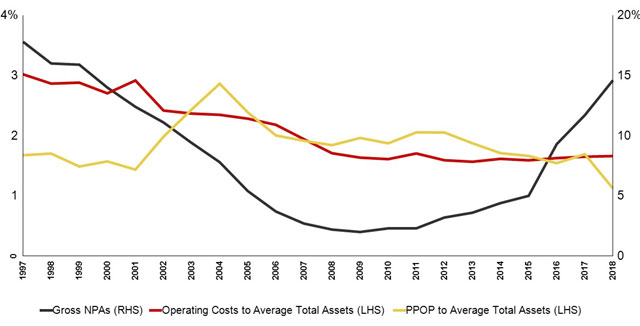
Figure 7 shows the three variables of cost of intermediation, PPOP, and gross NPAs of government-owned banks, as a group over the period of 1997 to 2018. The figure can be interpreted as follows. PSBs enjoyed a steady growth in productivity from mid-1990s onward till about 2010, as reflected in the decline in operating costs. PPOP as a proportion of average total assets increased with the productivity gains in these banks. During 1997-2005, part of the increased PPOP was presumably used to bring down the high level of gross NPAs that built up in the PSBs in the mid-1990s (Sengupta and Vardhan 2017). This would imply that the productivity gains enjoyed by these banks during this period effectively went to the defaulting borrowers via PPOP and NPA provisioning.
With the stagnation in productivity from 2010 onwards, the growth in PPOP also got stalled. When the next round of NPA build-up started from 2011 onwards, there were not enough productivity gains to address the rise in gross NPAs. Consequently, these banks had to raise large amounts of external capital from the government, as the internally generated capital was not enough to provide for the NPAs.
Figure 7. Cost of intermediation, pre-provisioning operating profits, and gross NPAs of PSBs (Including SBI), 1997-2018
Productivity gains for the private banks were mostly during the period 1997-2005, and even then, were not as substantial as those for PSBs. Compared to their public-sector peers, the private banks also had lower levels of NPAs (Sengupta and Vardhan 2017). Hence, they would have incurred lower credit loss provisions and the issue of productivity gains going to defaulting borrowers is less relevant for them.
Conclusion
It appears that any gains from efficiency improvement – instead of getting passed on to the broader economy – accrue to the owners, which in the case of 70% of the banking sector implies the government, and in turn these are potentially used to bail-out defaulting borrowers. It might be a matter of concern for policymakers that the other stakeholders of the banking system have not been benefitting from the efficiency gains. The uneven distribution of the gains might be due to unequal bargaining power of the various stakeholders, which might be an outcome of the lack of competition in the Indian banking sector.
One may argue that competition among banks would benefit borrowers and depositors, but not necessarily employees, because they might already be operating in a competitive environment at present. A few points might be worth noting in this context. Firstly, the banking jobs that are the most fungible across industries are those at the lower end of the professional hierarchy, and throughout our review period, this tier constituted less than 22% of the total employees of the banking system. Hence, competition from other industries for this section of employees would not impact the overall bargaining position of the labour. Secondly, employee wages across hierarchies are identical for all PSBs because they arise out of a wage accord that their unions collectively sign with the bank management. There is no competitive labour-market mechanism at work here. Third, PSB jobs are perceived to be similar to government jobs in terms of job security, easier working conditions, etc. This creates reluctance on part of the employees, especially those belonging to the clerical tier, to switch jobs, thereby exacerbating the problems associated with lack of competition. Finally, the wage differential between the public- and private-sector banking jobs is very high at the higher levels, but have near parity at the lower levels. This is because the PSBs dominate the banking employment landscape at the lower levels, where their salaries set a benchmark. All these factors contribute to limited competition for labour between the private banks and PSBs, and also between banks and other businesses, especially at the lower tiers of the hierarchy.
There are a large number of scheduled commercial banks in India, but the PSBs who currently account for roughly 70% of the system (and accounted for more than 90% in 1991) look nearly identical to each other in all aspects of banking business, thereby rendering the sector non-competitive. Perhaps the only way to ensure a more equal and broad-based distribution of the productivity gains among all stakeholders of the banking sector is to allow a diverse set of players that compete with each other for resources including employees and capital. This would essentially imply a reduction in the market share of the government-owned banks, and would foster greater competition in the sector.
Note:
- Loan prices typically include a risk premium and a maturity premium. Any change in the average riskiness of borrowers or in the average maturity of the loans would impact the loan premium. This implies that if during the period under review, the average maturity of loans went up or the riskiness of the average borrower increased, then even constant loan price premium might represent gains to borrowers. However, the data show that there has been no perceptible change in average loan maturity, which has stayed constant at around three years. Riskiness of the average loan is hard to assess purely from publicly available data. There is however a case to be made, looking at the rapid build-up of non-performing loans in the period from 2014 to 2018 that riskiness of loans was increasing in the period from 2005 onwards, which was not accompanied by a perceptible increase in loan price premium (Sengupta and Vardhan 2019). In the previous years (from 1997 until 2005), the loan pricing premium appears to have increased.
Further Reading
- Sengupta, R and H Vardhan (2020), ‘Productivity growth in Indian banking: Who did the gains accrue to?’, Indira Gandhi Institute of Development Research (IGIDR) Working Paper Series, 2020-024.
- Sengupta, R and H Vardhan (2019), ‘How banking crisis is impeding India’s economy’, East Asia Forum, 3 October 2019.
- Sengupta, Rajeswari and Harsh Vardhan (2017), “This time it is different: Non-performing assets in Indian banks”, Economic & Political Weekly, 52(12), 25 March 2017.

Comments will be held for moderation. Your contact information will not be made public.