

 28 June, 2019


The level of wealth inequality in India is close to that of some highly unequal countries in the world. This article assesses the long-term evolution of wealth inequality in the country for the period 1961-2012, and finds a strong rise in wealth concentration within the top decile of the population. It also explores the changing relationship between class and caste and the mechanisms behind rising inequality.
Economic inequality does not only depend on economic factors, which is evident from the observation that inequality is on the rise in many countries irrespective of their level of economic development. Demographic, social, and political environment also contributes to inequality. There are many examples of this in the world: apartheid in South Africa, legacy of racial discrimination in Brazil, oil in the Middle East – are some non-economic, country-specific issues that have had an impact on inequality. India has its own peculiar caste system since hundreds of years, which is rigidly stratifying the society.
I assess the long-term evolution of wealth inequality data series in India, with the aim to complement the debate on income inequality in the country. The measure of inequality used is the share of wealth owned by the top 10% of the population. The long time frame of 50 years from 1961 to 2012 shows the evolution of wealth inequality in independent India. I use a new methodology1 and mainly National Sample Survey (NSS) datasets for the analysis.
Further, I study the level of inequality along two dimensions:
- Between and within different caste groups: 2 There is concentration of forward castes (FC) in higher wealth deciles and of lower castes in bottom wealth This is termed as ‘sequential’ and ‘representational’ inequality in the literature (Jayadev et al. 2011).
- Between rural and urban areas: Rural and urban divide is predominant in the country. Two important observations are highlighted. First, the disparity between rural-urban areas has increased in recent years. Second urban areas are more unequal than rural areas.
Trends in economic inequality in India post-independence
There has been a strong rise in wealth inequality in India in recent decades, which is in line with the research on income inequality (Chancel and Piketty 2017, Banerjee and Piketty 2003).
The concentration of wealth at the top has increased tremendously in recent years. In 2012, the top 10% of the population owned 63% of the wealth, compared to 45% in 1981. Thus, there is a high level of wealth concentration within the top decile population. The top 1% of the population owns 30% of the total wealth, which is 50% of the total wealth of the top decile. Looking at time series3, we see that the shares of the top 10% and top 1% have consistently increased with every decade, except in 1971. The bottom 50% of the population own only about 8% of the total wealth, which highlights the ‘weak base’ of the Indian society; the middle 40% own 35% of the total wealth.
We see in Figure 1 that urban India is more unequal than rural India, though the increasing trend of inequality is present in both areas. In both urban and rural areas there is a predominance of the share of physical assets in total wealth. Land and building value forms almost 90% of the total wealth in the country, with higher share of building value in total wealth in urban areas. Financial assets comprise only 7% of the total wealth, which is very low compared to developed countries (48.3% in the US and 31% in France).
Figure 1. Wealth share of the top 10% in India, 1961-2012
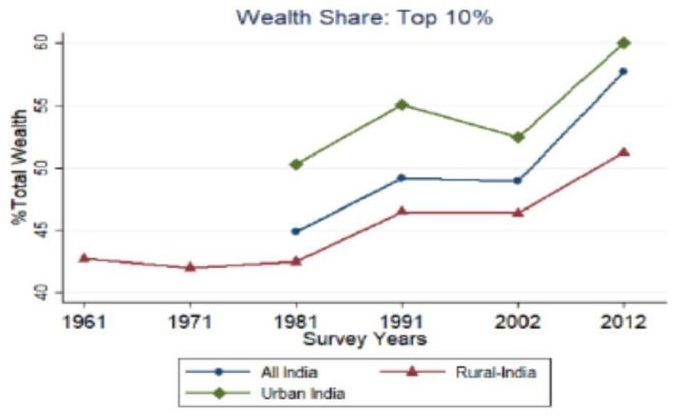
Notes: The wealth share of the top 10% shows an increasing trend. The top 10% of the population accounted for 63% of the total household wealth share in 2012.
Sources: Estimates are based on NSS All India Debt and Investment Surveys (AIDIS).
The increase in wealth inequality is partly a result of rising income and savings inequality, and partly due to the historical distribution of wealth in the society. Upper castes in most parts of the country have historically been endowed with land, and the improper implementation of land reforms has helped in the persistence of wealth inequalities.
Interplay between class and caste
General ranking order of education: Economic outcomes of caste groups
I rank different caste groups based on socioeconomic outcomes including average income, assets, and highest level of education among males and females. We observe a general pattern where lower-caste groups (SC/STs) are way below the overall averages in each category; OBCs and Muslims are closer to overall average but lower; and FCs are at the higher end. One important thing to notice is the poor education levels among Muslims – and these are in a way ‘forward’ Muslims because SC/STs and OBC Muslims are not a part of this group. One can look at different deciles and the trend remains the same. Another point to note here is the secular gender discrimination against women: the education level of women is lower than men across all caste groups.
Table 1. Average economic and educational outcomes across caste groups
|
Caste Groups |
||||||||
|
|
SC |
ST |
OBC |
FC (Brahmin) |
FC (Non-Brahmin) |
Muslim |
Others |
Overall |
|
Annual household income (in Rs.) |
89,356 |
75,216 |
104,099 |
167,013 |
164,633 |
105,538 |
242,708 |
113,222 |
|
Per capita annual income (in Rs.) |
19,032 |
16,401 |
21,546 |
35,303 |
36,060 |
20,046 |
56,048 |
23,798 |
|
Annual consumption of household (in Rs.) |
87,985 |
72,732 |
108,722 |
146,037 |
143,497 |
102,797 |
181,546 |
109,216 |
|
Per capita annual consumption (in Rs.) |
18,740 |
15,860 |
22,503 |
30,869 |
31,430 |
19,525 |
41,924 |
22,956 |
|
Assets (index) |
12.7 |
10.2 |
14.7 |
18.2 |
17.9 |
13.3 |
22.2 |
14.6 |
|
Highest adult education (years) |
6.7 |
5.9 |
7.8 |
11.5 |
10.3 |
6.6 |
11.6 |
8.0 |
|
Highest male education (years) |
6.3 |
5.6 |
7.5 |
11.3 |
9.9 |
6.0 |
10.5 |
7.6 |
|
Highest female education (years) |
3.9 |
3.3 |
5.0 |
8.6 |
7.8 |
4.6 |
10.0 |
5.3 |
Note: Two patterns emerge: (i) Economic outcomes: ST<SC<OBC=Muslim=Overall
There is a sequential and representational inequality in the society. Or, in other words, there is a segregation of FC towards the higher deciles and lower castes towards bottom deciles.
I begin with a simple hypothesis: If wealth inequality impacts every caste group in a similar manner, one should observe the same shares of population of different caste groups across wealth deciles as the overall population shares in a given region. However, we observe a lower population share (than their overall population share) of SC/ST/Muslims (Muslims who are not classified as SC/ST/OBC) in higher wealth deciles (top 10% or even in the middle 40%), and higher population share in lower wealth deciles (bottom 50%). OBCs are more or less distributed in same share across all the wealth deciles as their share in overall population. FCs (Hindus who are not SC/ST/OBC) are over-represented in higher deciles (Figure 2). This shows that SC/STs and Muslims have representational inequality. I term this as ‘ordinal polarisation’ in the society. Figure 2 highlights the caste-wise distribution of population in rural and urban areas separately.
Figure 2. Proportion of different castes in different wealth deciles
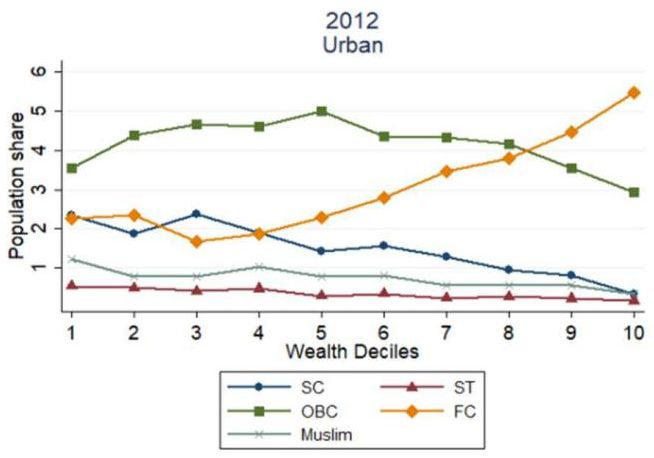
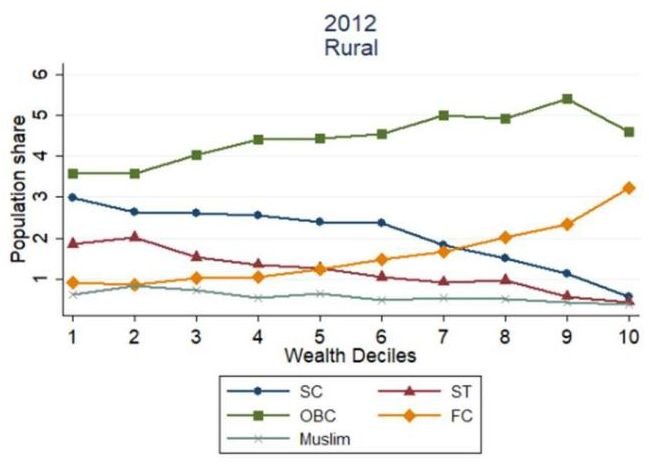
Note: We observe that FC group’s population share is more than 50% in the top decile whereas it forms only 20% of urban population share.
Within caste groups too, economic inequality is very high hinting at heterogeneity (variation) within these big caste groups.
Next, it is crucial to look at inequality within the caste groups because any grouping inherently assumes homogeneity within that caste group. We observe that within every caste group, the wealth share of the top 10% is more than 45%. FC is an outlier with highest within-caste inequality (Figure 3). This points towards the existing heterogeneity within these caste groups and this has increased in recent decades. A repercussion of increasing within-FC inequality is the evolving demand for reservation/quotas from sub-castes within FC groups, which was limited to OBC/SC/ST4. The government responded to the demand by providing 10% reservation to economically weaker sections.
Figure 3. Share of wealth owned by top deciles within caste groups
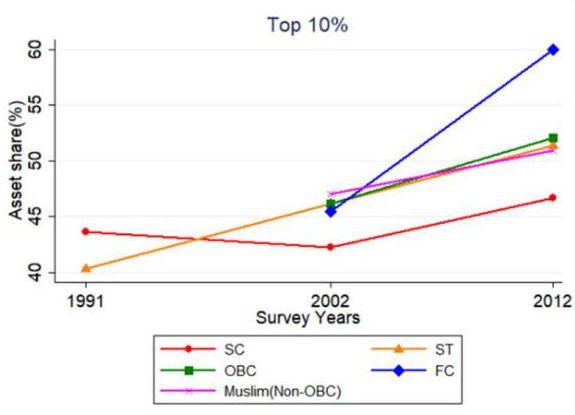
Note: Top 10% within FCs own around 60% of the total FC household wealth.
Concluding remarks
The level of wealth inequality in India is very high and close to some highly unequal countries in the world. The share of wealth owned by the top decile in India is higher than that in France (55%), Spain (56.5%), and UK (50%) but less than that in Russia (>70%),and the US (77%). China comes close to India with around 65% of the wealth owned by the top decile. Given that India is still a growing economy the threat of increase in economic inequality is higher than that for other stabilised economies. Hence, these wealth and income inequality figures should be taken as a wake-up call.
There is not enough convergence in average wealth across castes groups and hence the debate around economic benefits being captured by the reserved caste groups lacks evidence. There seems to be a development of rich ‘creamy layer’ in every caste group (including SC/ST/OBC) and hence there is a need of informed non-political debate to correct this anomaly. The creamy layer criterion5 for the OBC group is avoiding this problem to some extent. The current reservation policy for poor people is a step in the right direction, but the proposed thresholds6 for reservation fixed by the government are too high.
There is a need for more nuanced research to identify the reasons behind increasing inequality in India. There is no denying that India has to take more redistributive measures to check the increasing income and wealth inequality. Since land is a major asset in total wealth, it is important to target land (inflation in prices, land reforms, and so on) in the short run, while developing other equitable forms of wealth in the long run. It is also important to increase spending on education in India. Unfortunately, in the last few years, the spending on education as a share of GDP or as a share of total expenditure has gone down.7 This needs to be reversed.
Notes:
- Generalised Pareto Interpolation methodology has been developed by the World Inequality Lab. It extrapolates the full distribution from the tabular data, which is usually provided in survey reports.
- I consider five caste groups. The first three castes are Scheduled Castes (SC), Scheduled Tribes (ST), and Other Backward Classes (OBC) irrespective of religion. Forward castes (FC) are those who are Hindus but not classified as SC/ST/OBC. FCs are further split into Brahmins and non-Brahmins in Table Muslims, who form the fifth category, are those who are Muslim by religion but do not fall under SC/ST/OBC groups.
- A time series is a sequence of data points recorded at specific times.
- Reservation is a term used in India for quotas. Government provides reservation based on caste. SC/STs were accorded reservation in proportion to their population share in the Constitution after independence. OBC demand for reservation was met in 1980s after the famous Mandal Commission report.
- Children of persons having a gross annual income of Rs. 800,000 or above for a period of three consecutive years would fall under the ‘creamy layer’ category and would not be entitled to the benefit of reservation available to OBCs.
- These include annual household income of less than Rs. 800,000; agricultural land of less than five acres; residential house less than 1,000 square feet; residential plot less than 900 square feet in notified municipality, and 1,800 square feet in non-notified.]
- 7% of GDP (gross domestic product) in 2017-18 (Budgeted Expenditure) versus 3.1% of GDP in 2012-13.
Further Reading
- Banerjee, A and T Piketty (2003), ‘Top Indian Incomes, 1922-200’.
- Borooah, Vani K (2005), “Caste, Inequality, and Poverty in India", Review of Development Economics, Vol. 9, No. 3, pp. 399-414.
- Chancel, L and T Piketty (2017), ‘Indian income inequality, 1922-2015: From British Raj to Billionaire Raj?’, WID.world Working Paper Series, No. 2017/11, p. 71.
- Deshpande, Ashwini (2001), “Caste at Birth? Redefining Disparity in India", Review of Development Economics, Vol. 5, Issue 1, pp. 130-144.
- Jayadev, Arjun, Sripad Motiram, and Vamsi Vakulabharanam (2007), “Patterns of Wealth Disparities in India during the Liberalisation Era", Economic and Political Weekly, Vol. 42, Issue No. 38, pp. 3853-3863.
- Jayadev, Arjun and Sanjay G Reddy (2011), “Inequalities and Identities", SSRN Electronic Journal.
- Subramanian, S and D Jayaraj (2008), ‘The Distribution of Household Wealth in India’, in JB Davies (ed.), Personal Wealth from a Global Perspective, Oxford University Press, pp. 112-133.
- Zacharias, Ajit and Vamsi Vakulabharanam (2011), “Caste Stratification and Wealth Inequality in India", World Development, Vol. 39, Issue 10, pp. 1820-1833.

Comments will be held for moderation. Your contact information will not be made public.