
.svg)
.svg)
.svg)

.svg)

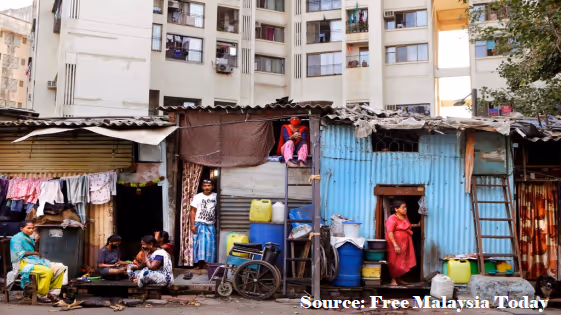
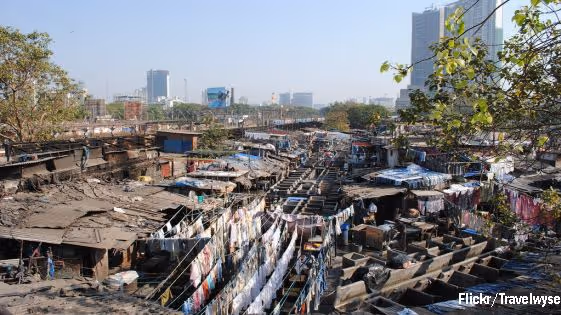
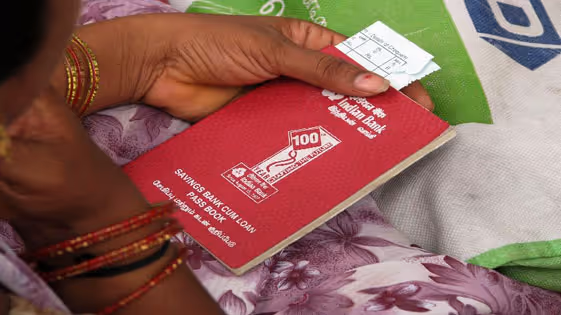
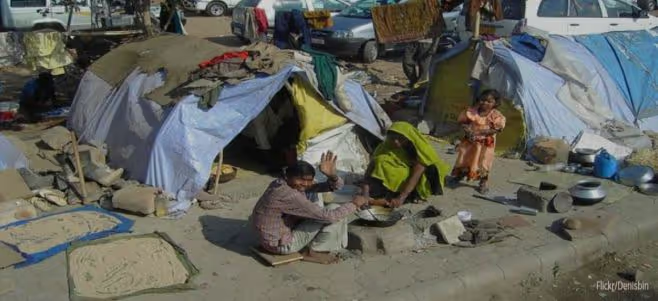
While several commentators have highlighted the plight of migrants due to the ongoing Covid-19 crisis, less is known about how low-income families living in urban shanty towns are faring. Afridi et al. began conducting a phone survey on 3 April – after the Covid lockdown was announced on 24 March – among a sample of households in the industrial areas of Delhi, to assess the impact on their livelihoods, and physical and emotional well-being. In their recent note, the researchers discussed findings from the initial, more stringent period of the lockdown (3-19 April). In this follow-up note, they report findings from Phase 2 of the lockdown, following some easing of restrictions (20 April-3 May).
The dates of survey of our respondents (who are a random sample of about 1,500 households across five districts of Delhi) were randomly selected. Hence, respondents who were interviewed earlier (Phase 1) are mostly similar in socioeconomic characteristics to those who we interviewed later, after 19 April in Phase 2. This allows us to compare the experiences of the sample in Phase 1 and Phase 2 and attribute any differences in their responses to the length of time that they have been exposed to the lockdown.
What has been the impact on earnings and incomes over a month (3 April- 3 May) of exposure to the lockdown? Have the policy responses through food and cash transfers to low-income households in these urban clusters improved relative to the early phase of shutdown? Are women and men more stressed following the extension of lockdown, relative to the initial days? Is the health communication strategy of the government effective in sustaining social distancing and hygiene practices?
Survey data from up until 19 March capture responses of 456 households, and between 20 March and 3 May of 931 households. Our combined sample consists of women and men in 1,387 households during the entire period.
Have unemployment and earnings worsened over the course of the lockdown?
Overall, our survey continues to indicate a massive shock to the livelihoods and wage earnings of these families. As expected, the vast majority of the workers in these residential areas (~90% of the men) have been completely unable to work, and this situation has not eased over time, as suggested by the responses in Phase 2, even with the relaxing of some restrictions. Consistently, around 85% of the respondents have not earned any income from their main occupation. The proportion reporting non-receipt of wages is 12 percentage points higher in Phase 2 than in Phase 1.
Figure 1. Livelihoods and earnings
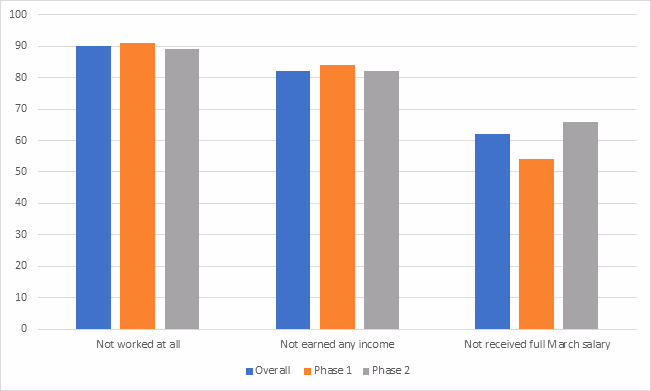
Note: The overall sample covers the period 3 April-3 May. Phase 1 refers to respondents surveyed between 3 April-19 April, and Phase 2 refers to respondents surveyed between 20 April and 3 May. The reference period for all respondents was from 25 March until the date of survey.
A larger proportion of those reporting unemployment are casual workers (~20%) in Phase 2 compared to Phase 1 (~9%). In terms of loss of livelihoods, wage labourers (for example, those employed in a specific sector such as manufacturing) and casual labourers (daily wagers not attached to one specific sector), thus, are by far the most adversely affected (45%), followed by the self-employed in informal sector (~31%). Of those who were gainfully employed before 24 March and reported some days of work post lockdown, the daily earnings have declined by 77% for the entire sample across both Phases - from an average of Rs. 373 to Rs. 87 per day.
Figure 2. Distribution of unemployment
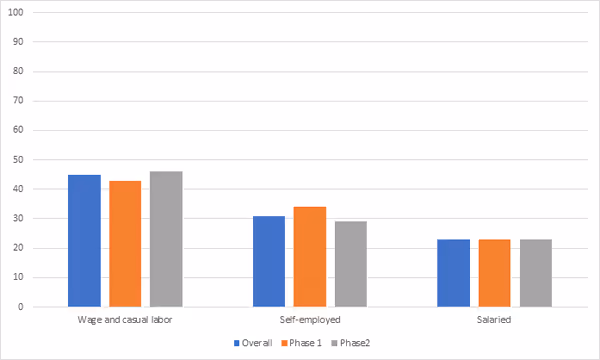
Note: The overall sample covers the period 3 April-3 May. Phase 1 refers to respondents surveyed between 3 April-19 April, and Phase 2 refers to respondents surveyed between 20 April and 3 May. The reference period for all respondents was from 25 March until the date of survey.
Many of the respondents surveyed rely on friends and family to tide over temporary setbacks. We asked about job losses among their social networks as this would presumably lead to higher levels of stress than otherwise. Seventy seven percent report loss of job in their family, and over 72% within their network of friends and relatives. More respondents report loss of job within their social network (family, relatives, and friends) in Phase 2 (74%) compared to Phase 1 (66%). A majority of respondents continue to perceive the job losses as temporary but there is an increase in the proportion who perceive the job losses in their social network as permanent – from 14% in Phase 1 to 27% in Phase 2, suggesting that as the duration of the lockdown increased, more workers see unemployment as a permanent job loss.
Has psychological stress worsened?
Financial concerns continue to be the number one source of stress for both men and women across the period and between Phases. We decipher an increase in health concerns, depression and anxiety, as well as sleep disorders in Phase 2 relative to Phase 1 for both men and women. Women continue to exhibit higher levels of stress, overall, than men.
Figure 3. Emotional well-being
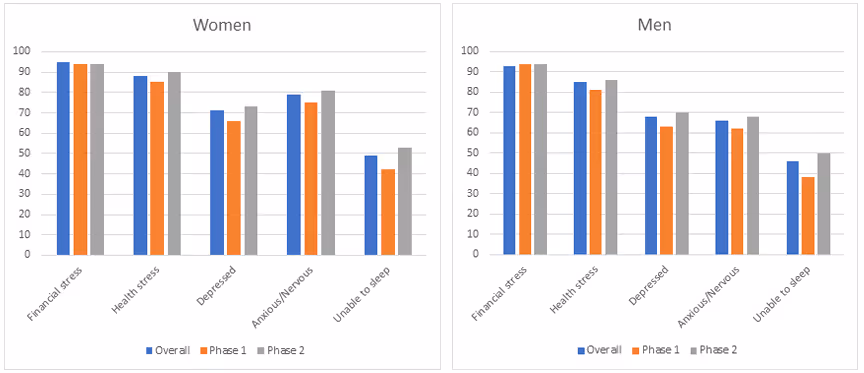
Note: The overall sample covers the period 3 April-3 May. Phase 1 refers to respondents surveyed between 3 April-19 April, and Phase 2 refers to respondents surveyed between 20 April and 3 May. The reference period for all respondents was from 25 March until the date of survey. Response is recorded as on the day of the survey.
These numbers indicate that as the shutdown in social and economic activity stretches out, mental distress is likely to increase. This is a deeply neglected aspect of the ongoing pandemic that ought to be addressed since it can have repercussions on productivity of workers, and may worsen if economic distress continues or gets exacerbated.
Has outreach of public support improved?
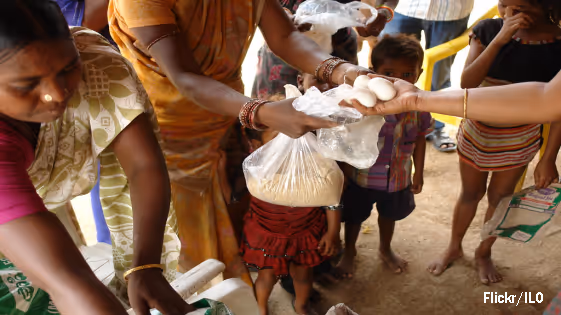
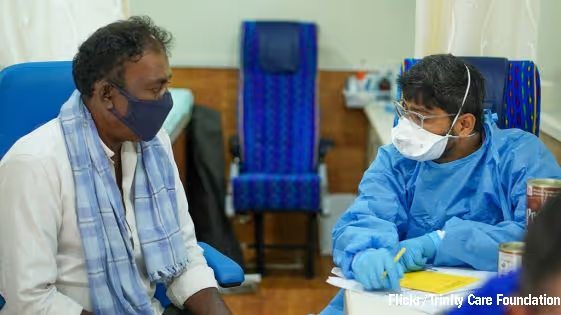
Fifty six percent of the respondents report receiving some kind of assistance or help during the lockdown, an increase from about 47% in Phase 1. Government assistance – primarily in the form of food and groceries – continues to be the leading source of assistance received by the households, amounting to almost 90%. However, the proportion of respondents reporting insufficient food and essentials has also increased from 34% to 43%, and the proportion reporting inadequate government assistance has gone up slightly from 70 to 73% between the two phases. Thus, even though the outreach of the government has perceptibly improved – either because the respondents’ expectations have also gone up or their awareness about the availability of assistance has increased – the reported inadequacy of assistance has risen. The silver lining is the reported improvement in medical assistance over time, as shown by the response in Phase 2.
Figure 4. Government and other assistance
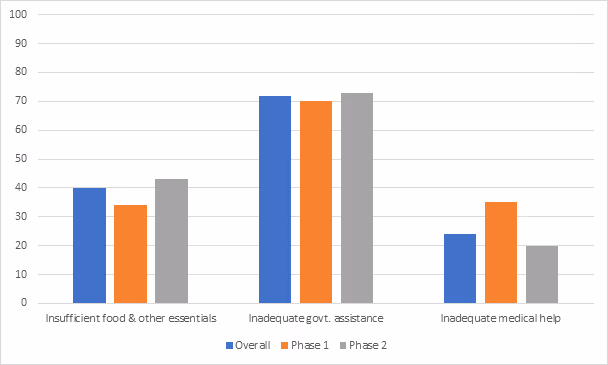
Note: The overall sample covers the period 3 April-3 May. Phase 1 refers to respondents surveyed between 3 April-19 April, and Phase 2 refers to respondents surveyed between 20 April and 3 May. The reference period for all respondents was from 25 March until the date of survey. Response is recorded as on the day of the survey.
Are social distancing and personal hygiene practices here to stay?
The overwhelming – and worrying – answer is ‘no’. Community health practices, in terms of avoiding social interactions and maintaining personal hygiene, have not gone up and may have gone down. This is particularly true for social gatherings, which seem more likely to occur in Phase 2. It is natural, given the exigencies of the high population density in these residential locations, that maintaining physical distance over long periods of time can be difficult and are likely to wane as we progress further into the lockdown. With an expected increase in infection rates as the lockdown eases and social and economic activities resume, there is an urgent need to continue educating and sensitising this population on health and distancing practices.
Figure 5. Community health practices

Note: The overall sample covers the period 3 April-3 May. Phase 1 refers to respondents surveyed between 3 April-19 April, and Phase 2 refers to respondents surveyed between 20 April and 3 May. The reference period for all respondents was from 25 March until the date of survey. Response is recorded as on the day of the survey.
On the positive side, only about 14% of the sample report having fallen sick after the lockdown mainly with a combination of symptoms: fever, fever and cough, cough. About 3% knew of Covid-19 positive cases in their locality.
While the reported physical impact (in terms of poor health) of Covid-19 among our sample appears to be low and risen marginally from 10% to 14% over time, the psychological impact remains very high and has worsened (by 10-11 percentage points for some measures) with the prolonging of the shutdown and despite easing of some restrictions.
Our findings suggest low rates of health shocks but high levels of financial hardship, anxiety and psychological distress, which are likely to persist even as restrictions on social and economic activities ease. In the trade-off between health and economic well-being, our survey suggests that the latter figures more prominently among the urban poor. Alleviation of the financial hardships faced by these households through substantive public transfers today are necessary to prevent continued economic and psychological distress in the longer term.
Published in collaboration with The Wire.


.svg)

.svg)
%201.svg)
.svg)
.svg)