

 21 July, 2023


Building on some of the key contributions to the Great Indian Poverty Debate, Dhananjay Sinha assesses the economic transformation in India over the past few decades. He outlines the lack of private capital expenditure and declining per capita income in India. He also discusses the growth of the agricultural sector, and how this increased ruralisation affects the demand for food grains and other consumer goods. With this evidence, he concludes that the claims of declining poverty may be unfounded.
Every decade there seems to be a revisit to the Great Indian Poverty Debate. Lately, the debate has been muddled as the absence of official estimates and the rejection of the Consumer Expenditure Survey (CES) 2017-18 have engendered sharply divergent research conclusions. Such confusions are hazardous from a policy prescription standpoint.
The latest is a co-authored study based on the Periodic Labour Force Survey (PLFS) data (Panagariya and More 2023) which claims that, notwithstanding the lockdown shock, poverty has been on a declining trend. Earlier, Bhalla et al. (2022), had claimed an eradication of extreme poverty before the advent of the pandemic based on questionable extrapolations of the consumption distribution from the CES 2011-12 (Dutt 2022). Others like Jean Dreze, Himanshu, and Santosh Mehrotra have presented solid data to underscore that the poverty situation in the country has been worsening. On a higher poverty line definition than the Tendulkar line, Subramanian found that the poverty rate rose by 400 basis points to 35% in 2017-18 over 2011-12. Mehrotra and Parida (2021) backed the World Bank’s estimate of 56 million people being pushed into poverty in India in the aftermath of the pandemic. Ghatak and Kumar (2023) have also highlighted the rise in the fraction of the population considered undernourished, from 14.8% in 2013-15 to 16.3% by 2019-21.
One way to get to the reality of poverty reduction is to assess how the economic transformation has panned out structurally. Development models of structural transformation (such as those proposed by Kuznets, Solow, and Lewis) foretell that society should shift away from the subsistence sector and towards the modern or capitalist sector, resulting in a broad-based increase in labour productivity and income with an increase in demand for manufactured goods and services, thereby favouring the terms of trade for the industrial sector. This results in a virtuous cycle of rapid growth and urbanisation, translating into an enlargement of organic employment opportunities and poverty reduction.
How have the indicators panned out in India against this typical trajectory? Unsurprisingly, multi-sector indicators narrate a different story: while the period following the advent of India’s economic reforms and global trade liberalisation since the late 1980s engendered a rapid transformation, it has stagnated or probably reversed over the past decade.
Chronic lack of industrial capital expenditure
The essence of economic transformation lies in the accumulation of capital investments. But since 2011, India has been experiencing the longest phase of private capital expenditure (capex) drag in the post-independence era, despite multiple attempts to crowd capital in through government investments in infrastructure and supply-side incentives, including tax cuts, production-linked incentive subsidy schemes, conversion of corporate bad debt into public debt through bank recapitalisation, bad debt resolutions, post-pandemic bounties, and gains in market share of large firms amid multiple economic shocks.
The share of public capital formation has risen to 8.4% of GDP in FY2022-23 from 6.5% in FY2019-20. But the ratio of private fixed capital formation-to-GDP, in both financial and non-financial sectors, has continued to decline – from a peak of 14.5% in FY2007-08 to 8.4% in FY2019-20 (according to the spliced 2004-05 GDP series), and to an estimated 6.8% in FY2022-23 (Figure 1). The crowding-in effect of government capex in the private sector was relevant during the 1980s when it contributed 55% to overall capital formation and when its role in industrial production was greater. Currently, government capex is mainly concentrated on public administration (51% of public sector capex) and construction (11.5%), which does not have a wide-ranging multiplier effect across the manufacturing sector in the near term.
Figure 1. Public and private capital formation, as a share of GDP
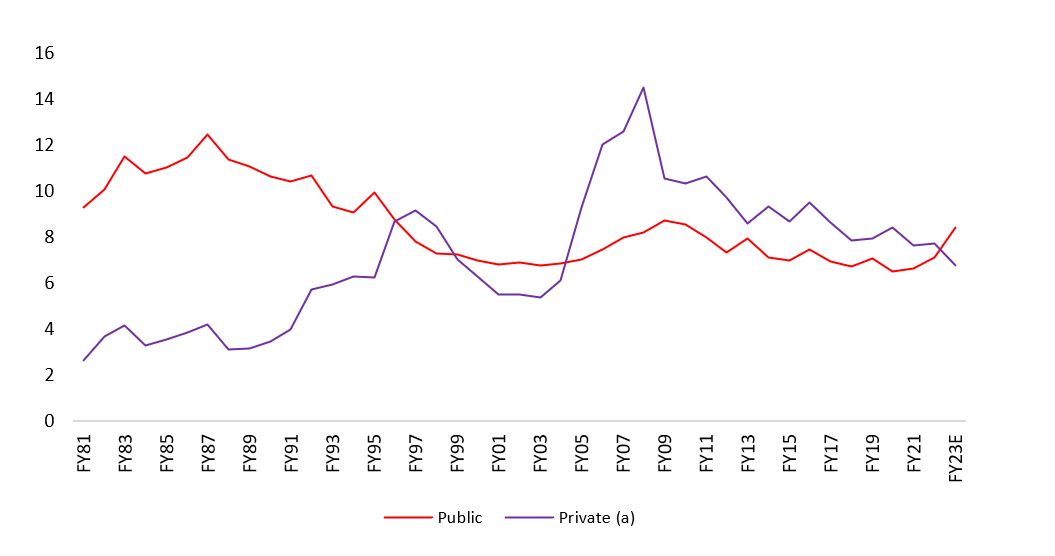
Source: Author’s representation using CSO and CMIE data.
Note: Private gross fixed capital formation estimated by splicing 2011-21 GDP series into the 2004-05 series.
![]()
The latest data shows that industrial bank credit growth plummeted sharply in March 2023 to 5.7%, with credit to large industries decelerating to a meager 3%. The dissipating working capital requirement after the episodic bounce due to post-pandemic credit and liquidity infusions tells that revival of investment project loans continues to remain elusive. Additionally, latest Centre for Monitoring Indian Economy (CMIE) data shows that growth in net fixed investments by the manufacturing sector stood at 4.8% in 2022-23 and the conversion of announced projects into actual capex declined to a 19 year low of 8.3% (project completed as a ratio of average announced projects in past two years); at the peak it was 37.8% in FY2013-2014.
Corporates have preferred to conserve their profitability, investing in smart technology amid rising uncertainty due to frequent exogenous domestic and global shocks. Global headwinds in the form of an adverse trade regime and liquidity tightening when India is adopting an export-led growth strategy is also a major drag.
Domestically, multiple shocks since the global financial crisis of 2008 have increased the volatility in the working environment of corporates. The 18% compound annual growth rate (CAGR) of average manufacturing sales during 2019-23 over the pre-pandemic period (compared to 3.8% during 2013-19 and 17% during 2007-12) has come with higher volatility due to a surge in commodity prices and concentration of market power (Acharya 2023), resulting in an elevated coefficient of variation1 of 1.9x (compared to 2.7x and 0.8x respectively). Notwithstanding the post-pandemic episodic surge in sales growth, the improvement in asset utilisation (the ratio of sales-to-gross fixed assets) of manufacturing and non-finance companies has been sub-par, falling from the pre-pandemic levels of 2.1x and 1.6x in FY2018-2019 to 1.9x and 1.4x in FY2022-23, respectively. As a result, the manufacturing sector has been utilising operating cash flows for purposes other than investing in fixed assets. Over the last three quarters of FY2022-23, the aggregate sales of non-finance, non-IT sectors have declined, implying that the post-pandemic bounce was ephemeral.
Figure 2. Corporate earnings per share growth (EPS) contrasted with consumption and GDP growth in the same period
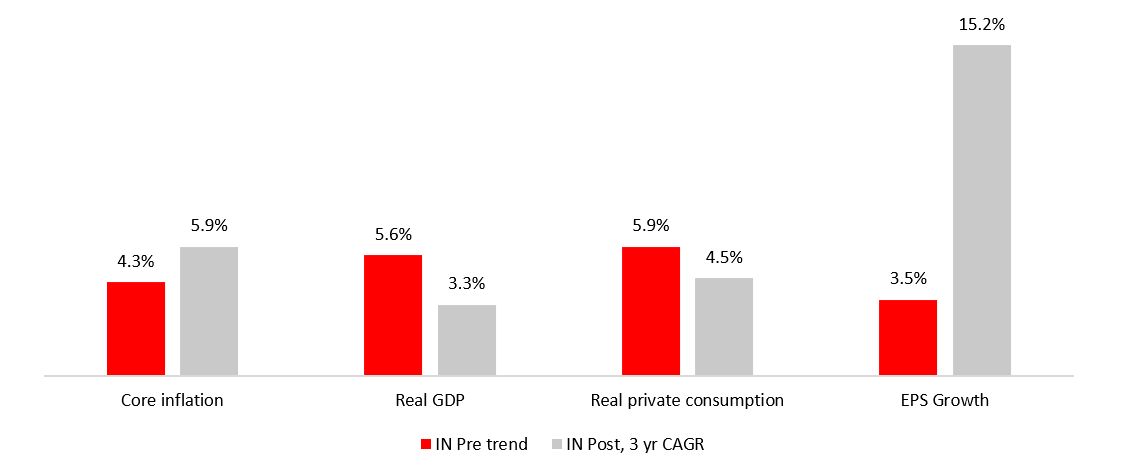
Source: Bloomberg data.
Notes: (i) Pre-Covid trend here implies average of annual growth between 2013-19 (ii) Post-Covid figures here implies CAGR from 2019-20 to 2022-23.
![]()
Fading transformative processes and the effect on household financials
The persistent lack of investments has led to a chronic lack of employment and income generation. The RBI’s survey of urban households (Q4 of FY2022-23) indicates that both employment rates and incomes have improved since the lows during the pandemic, but still remain weaker than they were in the pre-pandemic decade (Figure 3). The proportion of people who have experienced an improvement in employment (32% in March 2023 compared to 41% in September 2012) is slightly more than those who have experienced a rise in incomes (22% vs 50%). Thus, despite the post-pandemic recovery, per capita incomes may have worsened, especially considering that a majority of households have experienced a rise in the cost of living.
Figure 3. Perceptions about employment (left) and income (right), in percentage of sample
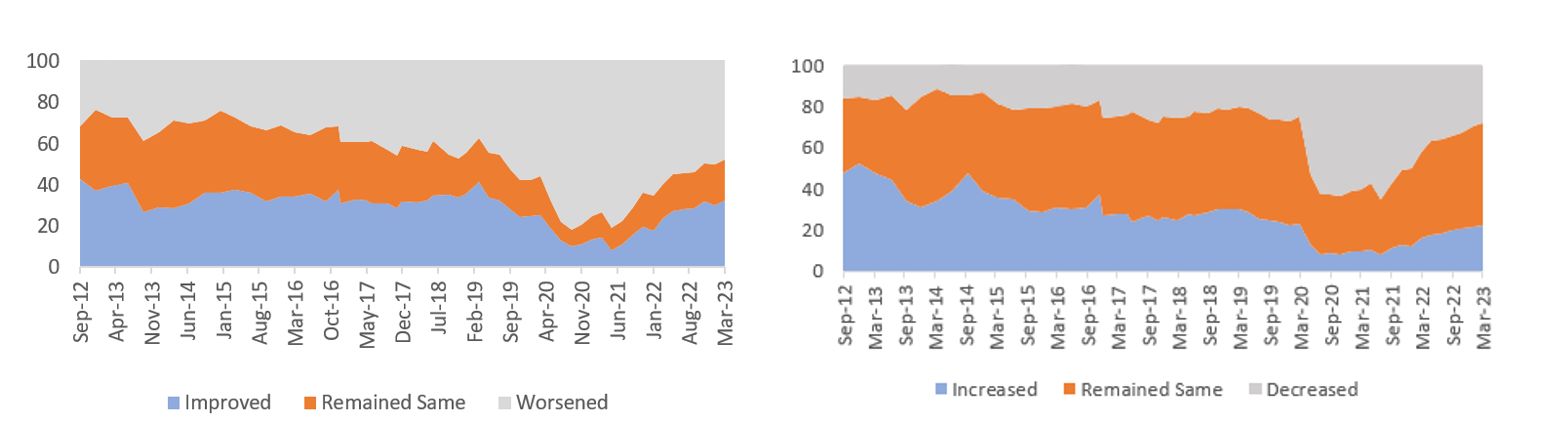
Source: Author’s representation using data from RBI’s Urban Household Survey.
![]()
The latest GDP data shows that real private final consumption expenditure (PFCE) has decelerated sharply to an average of 2.5% in the second half of FY2022-23 which is lower than the 4-year CAGR of 4%, and a considerable reduction from a peak of 8.4% in FY2007-2008. This consistent deceleration in household spending is due to significant lagging in household real income growth, particularly after FY2011-12.
Deriving the real household income proxy as a summation of PFCE and gross household savings deflated by retail inflation, Figure 4 reveals that in FY2022-2023 its growth fell to a low of 3.5% on 4-year CAGR from a peak of 8.8% in FY2009-2010. Hence, with household incomes decelerating faster than consumption since FY2011-12, the household savings rate has continued to decline and contributed to the continued lack of private capex and rising unemployment rate.
Proposed in the 1950s, Modigliani’s consumption smoothening thesis has it that people follow an income-spending adjustment process over their lifetime with higher savings and constrained consumption during rising incomes to provide for spending post-retirement. In the recent Indian context, this process has been pushed back due to persistent shocks impacting income situations and downtrading in consumption towards basic items like food. The resultant dent in savings and investments in education and skilling would reduce productive income potential and post-retirement prospects for a significant portion of the population.
Figure 4. Household spending and income growth
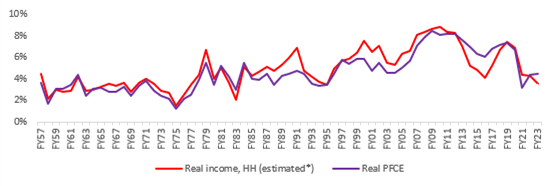
Source: Author's computations using CSO and CMIE data.
Notes: i) Household (HH) income derived from savings and consumption data. ii) 2004-05 GDP series taken till FY2011-12 and 2011-12 series thereafter.
![]()
The overt domestic indicators of faltering economic transformation reveal a telling comparison from a global perspective too, specifically after the global financial crisis of 2008. Industrial production (IP) growth in the US has improved from -0.3% during 2000-2012 to 1.1% during 2012-2022. Correspondingly, in the EU it rose from 0.2% to 1.1% in the same period. The trajectory of India’s industrial growth over the past 10 years remains feeble at 2.1%– decelerating sharply from an average of 7.7% during 2000-12. While this reflects the common trend of emerging markets losing momentum relative to advanced economies after the 2008 crisis, China still grew much higher than India or other EMs, at 7.7% over the past decade.
As a result, indexed to 1991 (at 100), India’s IP relative to the EU and the US rose to 290 and 240 by 2012 respectively. But subsequently, as the growth differential narrowed, the incremental rise has been modest to 330 and 270 respectively from 2012-2022. Relative to China, it is a significant decline to 15. This comparison explains why India has faced unemployment problems for over a decade, with the unemployment rate rising to a multi-decade high while for the US, it is at a low.
The rising dominance of the agriculture sector
The rising market share of large corporates has led to a rise in unemployment in urban areas as large firms gain at the expense of small employment-intensive firms (Acharya 2023). As per the CMIE, urban unemployment rate rose from 6.9% in FY2018-19 to 8.3% in FY2022-23 – this was concentrated among the , educated labour force. This has resulted in a structural shift towards ‘ruralisation’ as opposed to the expected transformation trajectory of the ascendency of the modern sector.
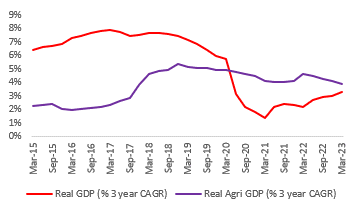
India’s agriculture sector has been gaining dominance, with a rise in workforce dependence on the agriculture rising from 42.5% in 2018-19 to 45.5% in 2021-22 according to PLFS data. Real agriculture gross value added (GVA) has grown at 3.9% on a 3-year CAGR basis in FY2022-2023, much higher than the 3.3% real GDP growth (Figure 5).
Figure 5. Agriculture GVA relative to overall GDP growth
Source: Author’s representation using CSO data.
![]()
As per data from CMIE, at the post-pandemic peak (October-December 2022), the agriculture sector absorbed a net additional workforce of 10 million since the COVID shock, while the industrial sector and services retrenched 5.6 and 2.5 million respectively. The construction sector added more than the initial decline due to the Covid shock. The aggregate employment across all sectors, at 407.6 million by Q4 of FY2022-23 was only 2 million higher than Q3 of FY2019-20, compared to an estimated rise in the labour force by about 17 million (assuming a growth rate of 1.4% per year) (Figure 6).
As a result of the incomplete urban recovery, the number of man-days added under MNREGA at 462 million in Jun 2023 is still 44% higher than in 2019. Arguably, the changes in the composition of the workforce and the rise in surplus labour has resulted in low average real wages.
Figure 6. Post-pandemic employment across sectors (in millions)
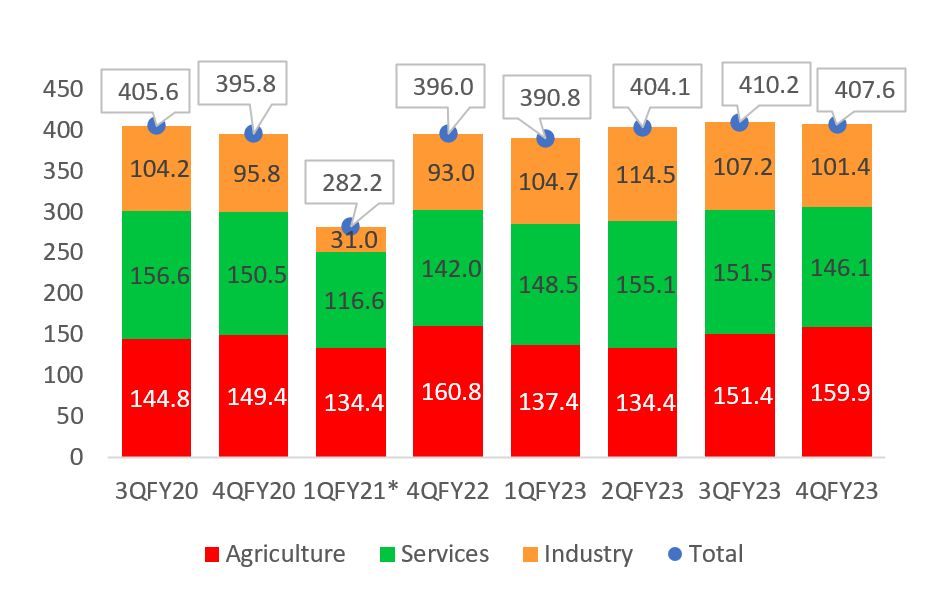
Note: ‘Industry’ includes employment in construction.
Source: Author’s representation using CMIE data.
![]()
India’s industrial production growth since 2012 has decelerated to 2.1% on a 10-year CAGR, and is somewhat lower than food grain production at 2.3% on a 10-year CAGR. This represents the convergence of the modern sector, represented by industrial production, with the subsistence sector, represented by food grain production. This signifies a trend reversal of the economy’s progress towards modernisation.
The net effect of a sub-par urban recovery and strengthening of the agriculture-based rural sector is that the volume for most consumer goods has structurally declined or sharply decelerated. These trends are embodied across multiple sectors. For instance, the seasonally adjusted volumes of two-wheelers in March 2023 were 20% lower than August 2022 and 30% lower than the 2018 peak six-monthly average. Seasonally adjusted passenger vehicles sales have also declined 10% month-on-month as of March 2023 and are 32% less than the 2018 peak six-monthly average. Growth in tractors has scaled down from a 16% year-on-year average growth during 2004-2014 to 8% since 2017, while the sale of heavy commercial vehicles (trucks) is at a 15-year CAGR of just 1.8%. Volume growth for the staple major Hindustan Unilever has declined from 7.5% in 2013-14 to a meagre 3.0-3.5% in just a decade, despite persistent gains in market share.
Effect of increasing ruralisation and rising demand for cereals
Engel curves and Bennet’s Law ordain that with the progression of structural transformation, characterised by rising incomes, household spending on food would fall as a proportion of the total expenditure, and they would consume relatively fewer calorie-dense starchy staple foods as they diversify into more nutrient-dense food items. Indeed, NSSO estimates show that India’s per capita consumption of cereals contracted by 1.7% annually from 12.9 kgs in 1993-94 to 10.4 kgs during the period of high growth in 2011-12, with a rising share of expenditure towards ‘non-essentials’. But that trend has since reversed. Moreover, demand projections from the National Centre for Agricultural Economics and Policy Research (2009) show that per capita cereal consumption in rural areas is 38% higher than urban areas. Hence, increasing ruralisation could be driving the higher cereal consumption at the national level.
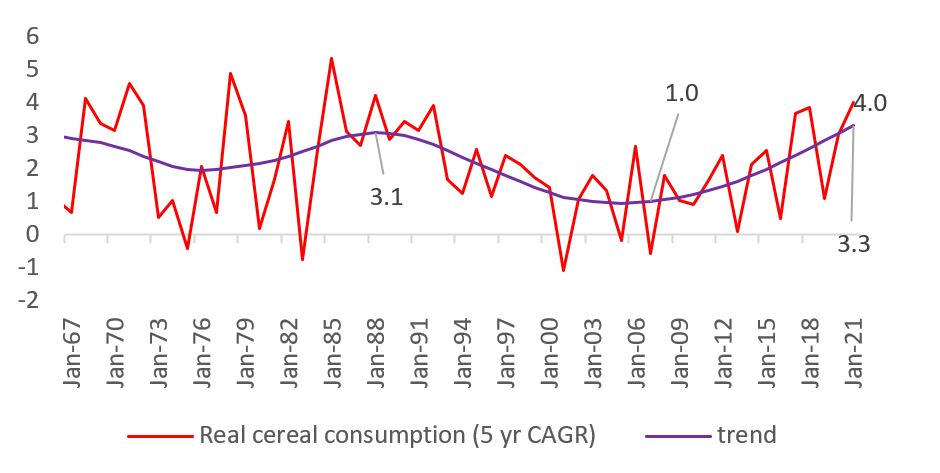
While the absence of the latest CES and nutrition consumption surveys make it difficult to make a precise judgment, the GDP expenditure series on cereals and bread reveal that there has been a rise in cereal consumption. Per capita real spending on cereals was rising by 2.2% in FY2020-21, while it was decreasing by 0.8% on average during the second half of the 2010s. These levels are higher than the increase of 0.8% during the late 1980s. Hence, while cereal production has also scaled up in FY2022-23), its structural growth at 2.7% is somewhat lower than the demand (which has been rising at 3.3% per year), which backs the rise in terms of trade for the agriculture sector in recent years. Currently, at 3.3%, cereal consumption has trebled since pre-GFC lows, and is higher than the last peak in 1988 (Figure 7).
Figure 7. Structural trend growth and 5-year CAGR in cereal consumption
Source: Author’s computations using CSO data and personal consumption expenditure data from GDP series.
![]()
The need for an urgent policy facelift
In 2013, Panagariya and More had a firmer stance on poverty in India: “No matter what criterion we choose (social, religious or economic groups), poverty has declined sharply between 1993-94 and 2011-12 with a significant acceleration during the faster-growth period of 2004-05 to 2011-12”. In contrast, their latest claims are qualified and 2023 attribute the decline to the distribution of free food to 814 million people in the aftermath of the pandemic, increased MNREGA allocation, and stronger agriculture sector production. Given that they haven’t delved into the dimensions of stagnating or declining structural progression, persistent unemployment, or lack of growth, their falling back on fiscal support as an explanation is an endorsement of the rising importance of the subsistence sector. A modification to the conclusion of Ghatak and Kumar (2023) that the structural composition of the economy, hunger, deprivation, and the movement of migrant workers favour the narrative that the poor may be worse off than a decade ago, appears more apt.
Thus claims of continued reduction in poverty or improvement in livelihood situation appear facile against the clutch of evidence outlined in this article. Far from getting complacent and feeding off such misplaced conclusions, India needs an urgent macroeconomic policy facelift, lest we fall back into a low-income trap.
Note:
- The coefficient of variation shows the extent of variance of data in a sample in relation to the mean of the population. It is calculated as the ratio of the standard deviation-to-mean. The coefficient of variation allows investors to determine how much volatility is assumed in comparison to the amount of return expected from investments - lower the value, the better the risk-return tradeoff.
Further Reading
- Acharya, V (2023), ‘India at 75: Replete with Contradictions, Brimming with Opportunities, Saddled with Challenges’, Brookings Papers on Economic Activity. Available here.
- Bhalla S S, K Bhasin and A Virmani (2022), ‘Pandemic, Poverty, and Inequality: Evidence from India’, International Monetary Fund, IMF Working Paper No. 2022/069.
- Drèze, J and A Somanchi (2023), ‘Weighty evidence? Poverty estimation with missing data’, Ideas for India, 10 April.
- Dutt, G (2022), ‘Has India eliminated extreme poverty?’, Ideas for India, 10 October.
- Ghatak, M and R Kumar (2023), ‘The simmering debate over poverty rate’, Mint, 4 May.
- Himanshu (2022), ‘Statistical priorities for the ‘Great Indian Poverty Debate 2.0’’, Ideas for India, 15 October.
- Mehrotra, S and JK Parida (2021), ‘Poverty in India is on the rise again’, The Hindu, 4 August. Also available here.
- Panagriya, A and V More (2023), ‘Poverty and Inequality: Before and After Covid-19’, Paper presented at the 3rd Columbia Summit on the Indian Economy.
- Subramanian, S (2020), ‘What is happening to rural welfare, poverty, and inequality in India?’, Ideas for India, 10 January.

Comments will be held for moderation. Your contact information will not be made public.