

 02 December, 2020


An extensive literature has considered the impact of air pollution on health. While studies have mainly focussed on outcomes such as general morbidity and mortality, this article evaluates the impact of pollution caused by coal-based power units on the anaemic status of young children and prime-age women in India. Factoring in these additional costs strengthens the case for a progressive shift to renewable energy and reduced reliance on coal.
The detrimental impacts of air pollution on various measures of health is now fairly well-documented (see, for example, Zivin and Neidell 2013, Greenstone and Jack 2015). While the early evidence came from developed countries, the more recent literature using data from developing countries, paints an even bleaker picture. This is particularly true of India. According to the World Health Organization (WHO) global air pollution database of the 20 most polluted cities in the world over the period 2008-2017, 13 are in India (16 are in the Indian sub-continent).
In recent research (Datt et al. 2020), we investigate the impact of air pollution generated by coal-based power units on the anaemic status of young children and prime-age women, in a developing country context. We also offer insights into the mechanisms through which exposure to coal exacerbates anaemia. While the impact of coal on other health outcomes has been studied in the literature, the distinguishing feature of our research is its focus on anaemia, a widely recognised and significant health condition.
Severity of anaemia in India
Anaemia among children and adults is a major health problem in India. According to the World Bank’s figures, the global anaemia rates in 2016 for children under five years and for women in the reproductive age, 15-49 years, were 41.7% and 32.8% respectively, while the comparable figures for India were 59% and 54%, underlining the greater severity of this problem in India.
We present in Figure 1 the district-level variation in the rates of anaemia for children (aged 0-5) and women (aged 18-49). In both panels of Figure 1, the darker shaded districts represent those with higher anaemia rates (thresholds for anaemia are detailed in the notes below the figure).
Figure 1. Proportion of children (0-5 years of age) and women (18-49 years of age) who are anaemic 2015-2016
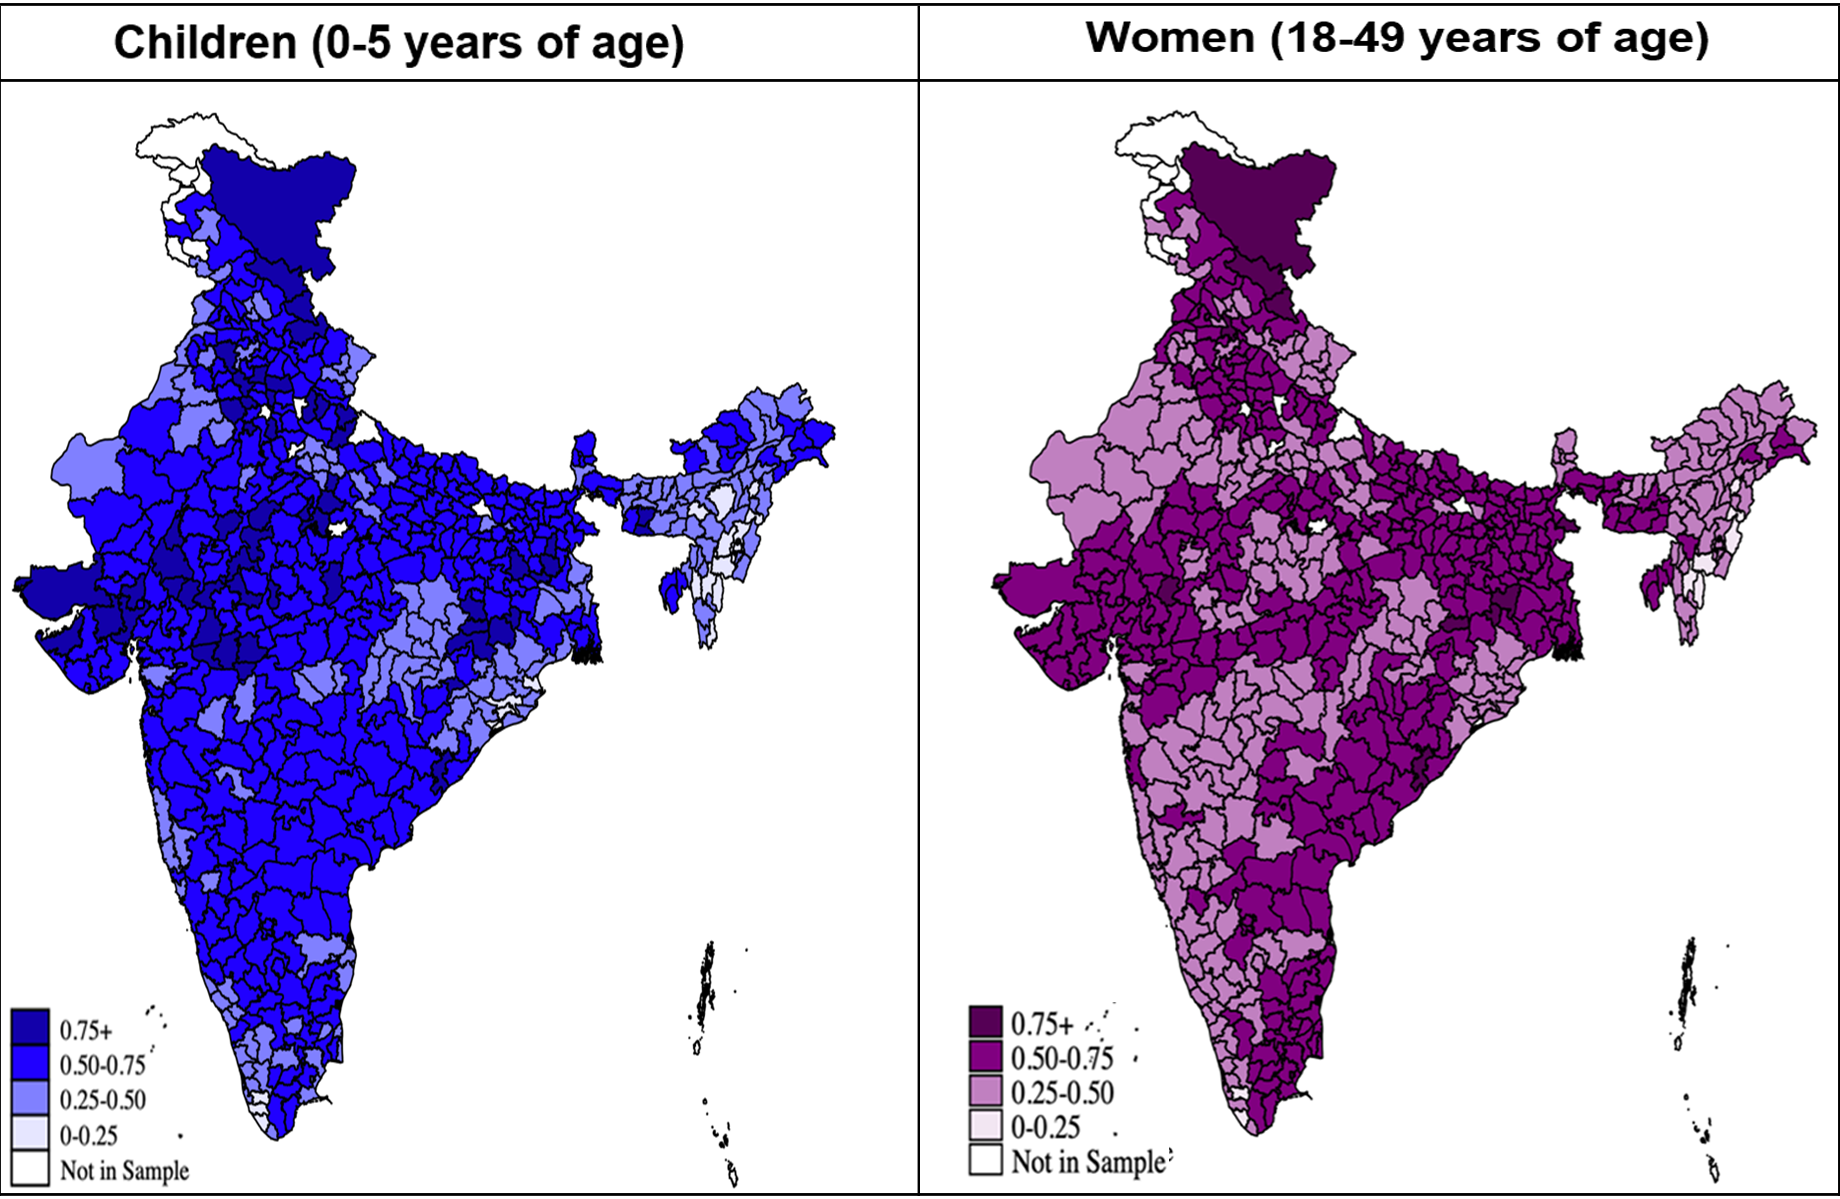
Source: Based on authors’ calculations using the Demographic and Health Survey (DHS) data for India from 2015-2016.
Notes: i) The left panel in Figure 1 presents the weighted average of the proportion of children (0-5 years of age) in each district categorised as anaemic, that is, altitude adjusted haemoglobin concentration (HBA) < 11.0 g/dl in children aged 6 - 59 months. The category 0-0.25 denotes up to 25% of the children in the district are anaemic, and so on. ii) The right panel of the figure presents the weighted average of the proportion of women (18-49 years of age) in each district categorised as anaemic, that is, altitude adjusted haemoglobin concentration (HBA) < 12.0 g/dl for non-pregnant women and HBA < 11.0 g/dl for pregnant women. The category 0-0.25 denotes up to 25% of the women in the district are anaemic, and so on.
There is a remarkable similarity between the two spatial maps – areas of high (low) anaemia for women are also those with high (low) rates of child anaemia. While this may be partly due to the hereditary nature of anaemia with mother-to-child transmission of iron deficiency and low haemoglobin (which we control for in our empirical analysis), we hypothesise that importantly, it reflects locational factors such as pollution due to emissions from coal units.
Our primary interest is to understand the detrimental effects of coal-fired power generation and the associated air pollution, in terms of the incidence of anaemia. We leverage the spatial variation in the presence of coal units at a point in time and the change in the number of coal units over a specific period to examine the effects of coal-induced pollution on the anaemic status of children and women. Over the last three decades, India has experienced rapid economic growth, which has contributed to a substantial increase in electricity demand, which has increased by 150%: from 388 terra watt hours (TWh) in 2001 to 989 TWh in 2015 (Ali 2018). The country has primarily built coal-fired power units to meet this demand. The data on power units and capacity obtained from the Central Electricity Authority of India (CEA), provide the year of commissioning of all units generating power (from 1922-2016), the main source of fuel for these units (coal, non-coal (diesel and oil), hydro, and nuclear), the capacity of each unit, and the district of location of each unit. Figure 2 shows that while total capacity from hydro and non-coal powered units has exhibited a modest increase over the period from the year 2000 onwards, total capacity generated from coal-powered units has increased exponentially, especially in the last 10 years.
Figure 2. Total capacity of power-generation units, by fuel type; 1922-2016
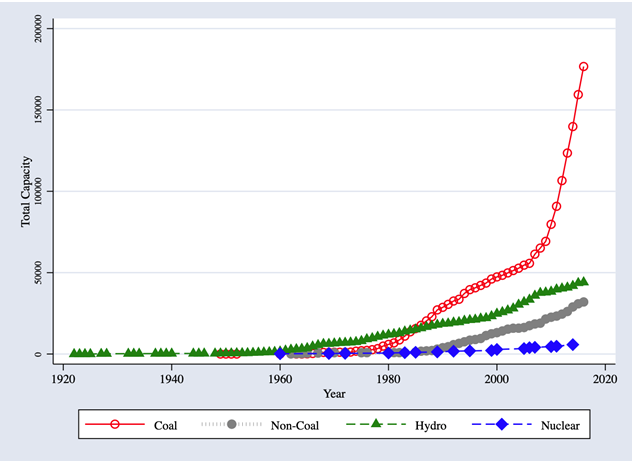
Note: Authors’ calculations based on CEA data.
Impact of coal-fired power generation on anaemia Using the most recent DHS data collected in 2015-2016 merged with data on the location and year of commission of all power units, we find that the number of coal units in the district at the time of birth (month and year of birth) is causally associated with a significant increase in the likelihood of being anaemic in the sample of children aged 0-5 at the time of the survey. The left panel of Figure 3 presents these results. An additional coal unit in the district at the time of birth is associated with a significant reduction in altitude adjusted haemoglobin (HBA) concentration in children by almost 0.06 g/dl and correspondingly, an increase in the likelihood of the child being anaemic by one percentage point. Given that on average, the likelihood of a child in this age group being anaemic is 59%, an additional coal unit in the district at the time of birth increases this likelihood by 1.69%. This figure also shows that the anaemia effects of coal plant units for children are primarily due to an increase in moderate or severe anaemia (thresholds for anaemia categories are detailed in the notes of this figure). The right panel of Figure 3 shows that while the effects are weaker for HBA levels for women, an additional coal plant in the district leads to a significant increase in the proportion of women who are mildly anaemic.
Figure 3. Number of coal power units and anaemia, children (0-5 years of age) and women (18-49 years of age)
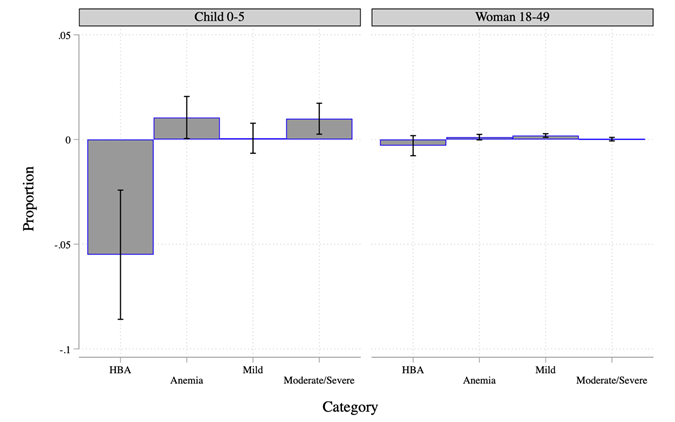
Note: Estimated effects of the number of coal plants in the district at the time of birth in case of children 0-5 years of age, and at the time of the survey for women 18-49 years of age (bars) and 90% confidence intervals 1 (solid lines) presented. Full set of results presented in Tables 4 and 5 of Datt et al. (2020) . Refer to categories termed as anaemic in Figure 1. Mild anaemia is defined as HBA of 10.0—10.9 g/dl for children, and 10.0—11.9 g/dl for non-pregnant women and 10.0—10.9 g/dl for pregnant women. Moderate anaemia uses HBA thresholds of 7.0—9.9 g/dl for both children and women whereas severe anaemia is defined as HBA <7.0 g="" dl="" in="" both="" children="" and="" women="" em="">
Figure 4 presents the effect of an increase in the number of coal plants in the district at the time of birth on the anaemic status of children for different sub-samples.
Figure 4. Variation in impacts of coal units in district at time of birth, anaemia status of children aged 0-5
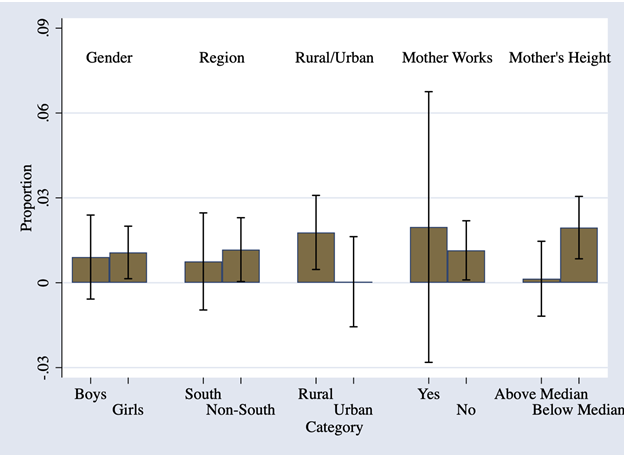
Note: Estimated effects of number of coal plants in district at the time of birth (bars) and 90% confidence intervals (solid lines) presented for each sub-sample.
The effects are stronger on girls, children born to mothers who are not working, mothers with poorer health (below median height), and those residing in rural areas. Additionally, through further statistical tests, we show that non-coal sources of power generation have little discernible impact on the likelihood of a child aged 0-5 being anaemic. Three other results are worth noting. First, cumulative exposure to coal units (measured as total coal plant years of exposure since birth) is also independently associated with a significant increase in the likelihood of a child being anaemic. Second, exposure in-utero also matters. Children who suffered environmental insults due to coal units in the first or second trimester are more likely to be anaemic aged 0-5. Third, the detrimental impacts of coal on child anaemic status do not merely reflect nutritional challenges that this population faces. This is because the magnitude of the impact of coal units on child anaemic status and HBA levels is approximately the same if we consider only the sample of children who are stunted, that is, those who have experienced nutritional deprivation in these young ages.
Turning to channels, we find that emissions from coal units are strongly (and positively) correlated with increases in the localised concentration of particulate matter of size 2.5 micrometres (PM2.5), one of the most harmful of airborne pollutants. We find that the rise in average PM2.5 concentration associated with the increase in the number of coal units is the primary channel for the adverse consequences on anaemia; conditional on PM2.5 concentration, the coal plant effect is no longer significant. Taken together, our findings highlight that the expedient generation of coal-fired power is occurring at the significant expense of children’s and women’s health in India.
Discussion
Although existing literature has considered the impact of air pollution, the focus has been on other outcomes such as general morbidity and mortality. To the best of our knowledge, ours is the first applied economics study to evaluate the impact of pollution generated from coal on the anaemic status of children and women in a less developed country. Our analysis adds to the growing evidence on the health costs of a fossil fuel-based energy policy by examining the effects on anaemia. Factoring in these additional costs due to coal-related pollution strengthens the case for a progressive shift to renewable energy and a reduced reliance on coal not just in India but also across other emerging market economies where economic growth has come hand-in-hand with a growing demand for energy.
I4I is now on Telegram. Please click here (@Ideas4India) to subscribe to our channel for quick updates on our content.
Note:
- A 90% confidence interval (CI) is a way of expressing uncertainty about estimated effects. Specifically, it means that if you were to repeat the experiment over and over with new samples, 90% of the time the calculated confidence interval would contain the true effect.
Further Reading
- Datt, G, P Maitra, N Menon, R Ray, S Dey and D Chowdhury (2020), ‘Impact from Pollution from Coal on the Anemic Status of Children and Women: Evidence from India’, IZA Discussion Paper No.
- Ali, S (2018), ‘The Future of Indian Electricity Demand: How Much, by Whom and under What Conditions?’, Technical report, Brookings India.
- Cohen, Aaron J, Michael Brauer, Richard Burnett, H Ross Anderson, Joseph Frostad, Kara Estep et al. (2017), "Estimates and 25-Year Trends of the Global Burden of Disease Attributable to Ambient Air Pollution: An Analysis of Data from the Global Burden of Diseases Study 2015", Lancet, 389: 1907 - 1918.
- Dey, Sagnik, Larry Di Girolamo, Aaron van Donkelaar, SN Tripathi, Tarun Gupta and Manju Mohan (2012), "Variability of Outdoor Fine Particulate (Pm2.5) Concentration in the Indian Subcontinent: A Remote Sensing Approach", Remote Sensing of Environment, 127: 153 - 161.
- Greenstone, Michael and B Kelsey Jack (2015), "Envirodevonomics: A Research Agenda for an Emerging Field", Journal of Economic Literature, 53: 5 - 42.
- Zivin, Joshua Graff and Matthew Neidell (2013), "Environment, Health, and Human Capital", Journal of Economic Literature, 51: 689 - 730.

By: Gaurav Datt 09 December, 2020
Thank you for your interest in our paper and your questions and comments. Here’s our brief response. i) Our estimation controls for district-level placement issues through district fixed effects. In addition, we also control for economic wellbeing both at the district and household level by conditioning our estimates on the district-level measure of night lights as well as household characteristics related to asset ownership, type of dwelling and access to facilities. The paper has the details. ii) In light of the above, we do not think urban v rural estimates are indicative of a confounding with poverty levels. iii) Districts are large geographical entities. However, (a) requisite data for a finer disaggregation are not available. And (b), we would expect the relationship to be stronger at a finer level of disaggregation. To that extent, finding significant effects at the district level suggests that the true effects may be stronger still. iv) The same applies to wind patterns that are likely to diffuse emissions beyond the district of location of coal plants. Thus, our estimates can be interpreted as offering a conservative lower bound. v) Nothing in our estimates implies or requires that coal plants are the sole driver of ambient air pollutions. However, the link between coal plants and air pollution is well-established in the literature (also evident in our data). What we find is that the link is strong enough for us to discern an effect of exposure to coal plants itself on anemia. Though, our paper could also be read as providing evidence for the detrimental effect of air pollution on anemia prevalence. vi) Your point about usage of coal plants (not just their number) is correct. Unfortunately, we do not have year-wise data on plant load factors to assess if that would make a difference. It is nonetheless notable that even the relatively blunt indicator of the number of coal plants turns out to be significant. Our thanks again for your interest and feedback on our piece. __________