

 03 December, 2018


Independent candidates are often deemed ‘frivolous’ or ‘spoilers’ by mainstream political figures and authorities, although there is little to no evidence on their effect on elections. This article finds that independent candidates decrease the chances that a Lok Sabha constituency elects a member of the party or coalition that forms the national government. It suggests that participation by independents has a high price – a lesser role for the constituency in policymaking.
India has witnessed a massive proliferation of independent political candidates over the past 40 years. In the last election to the Lok Sabha1 in 2014, 3,234 independents contested the election across the country – an average of almost six per constituency. While independent participation has swelled, the electoral success of these candidates has remained piddling, as they collectively obtained less than 5% of the total votes per constituency in the last election. In the exceptional cases where they do win, they have little to no direct influence on policy, as they have no formal affiliation with the established political parties that typically wield power. Low vote shares and little direct policy influence drive the widely-held belief that independents are unimportant for political representation.
However, to assume independents are politically inconsequential is to ignore the many other channels through which they may affect outcomes, especially the process determining the selection of political representatives. Our recent research (Kapoor and Magesan 2018) investigates the causal effect of independents in India from several angles: Do independents increase voter participation? Do they alter the outcome of the election in terms of who wins? If yes, then why? Our findings draw into question the belief that independents are unimportant for representation.
Research strategy
Our research exploits three unique features of the Indian electoral system to uncover the causal effect of independents on electoral outcomes. The first is the fees citizens are required to pay for their participation as candidates. India, unlike most other democracies, has a two-part fee schedule where members of scheduled castes or tribes (SC/ST) pay a lower fee than members of the general population2. The second feature is the reservation of political seats. Of the 543 Lok Sabha constituencies, 412 are open in the sense that anyone can hold the seat, while 131 are reserved for members of SC/ST populations. Importantly, only SC/ST candidates can contest the seat in a reserved constituency. The third feature is a reform on entry fees following the 1996 Lok Sabha elections. From 1947 until 1996, the deposits were set at Rs. 500 for members of the general population and Rs. 250 for members of SC/ST populations. By 1996, years of price inflation had eroded the real value of the fee to almost nothing. Due to the attendant massive growth in independent candidates the costs of administering elections became exorbitant for the Election Commission of India. Partly as a consequence, the Commission increased both fees to Rs. 10,000 for the general population and Rs. 5,000 for SC/ST populations, amounts that represented a significant fraction of the average income in India at the time. The three features imply the reform increased the fee by more for candidates contesting open constituencies.
The disproportionate fee increase had no effect on the participation of candidates with a party affiliation, including candidates from national parties like the INC (Indian National Congress) or BJP (Bharatiya Janata Party), and regional parties that draw support in one or a handful of states. The disproportionate increase instead affected participation by independents. This is unsurprising, as party-affiliated candidates can rely on party resources for covering their fees, while independents are typically self-financed and more vulnerable to increases in the financial cost of competing in an election. As such, the 1996 reform gives us a ‘treatment’ and ‘control’ group3 to compare and to uncover the effect of independents on electoral outcomes.
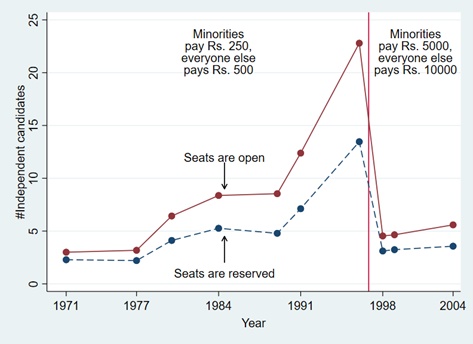
The effect on the participation of independents is illustrated in Figure 1. The blue dots represent the average number of independents in reserved constituencies for each Lok Sabha election that took place between 1977 and 2004. The red dots do the same but for independents in open constituencies. The figure shows independent participation was on the rise everywhere leading up to the 1996 reform, that there was sharp decline in their participation following the reform, and that the decline was more pronounced in open constituencies. The relative decline induced by the disproportionate fee increase is what we exploit to recover the causal effects of independents on electoral outcomes.
Figure 1. Reform on entry deposits and the participation of independent candidates
Main finding
Our estimates show that a one-standard deviation4 increase in the number of independents decreases the probability of the constituency electing a governing-party representative by 30 percentage points5. Our results are robust to controls for various factors which, when not controlled for, can generate an artificial relationship between the number of independents and constituency representation in government.
Why would independents decrease the chances of electing a governing-party representative? We show that a one-standard deviation increase in the number of candidates: (i) increased voter turnout by 5-6 percentage points; (ii) increased the collective vote share of independents by 9-10 percentage points; (iii) and decreased the vote share of the winner by about 5 percentage points. The first result implies independents bring out more voters. The first two results together imply independents induce some voters to switch who they vote for, because independent vote share increases by more than the increase in turnout. Both forces lower the threshold for winning the election – independents allow winners to win with fewer votes. And, instead of electing a candidate who has a ‘seat at the table’ in government, constituencies elect a candidate from the opposition. More often than not, this candidate comes from a smaller regional or ethnic party (Kapoor and Magesan 2018).
The election of an opposition member may prove costly for a constituency, as opposition members may be less able to funnel resources into the constituency. This would be in line with results from a large body of empirical work (for example, Asher and Novosad 2017, Khemani 2007), which shows constituencies tend to perform better economically when their local representative is a member of the governing party.
Conclusion
Should independents be discouraged from participating as candidates in elections? Not necessarily. Our results for voter turnout and the distribution of vote shares are also consistent with the idea that independents give voters better opportunities to express their preferences. This can improve political representation, as independents are free from the dictates of a party line, and have the flexibility to represent local preferences in a way that party-affiliated candidates often do not. To answer the question of whether independents should be discouraged, we would need to know if these advantages are outweighed by the disadvantages of not electing candidates from the governing party, or coalition of parties, that forms the national government. This is an issue we have left for future research.
Notes:
- Lok Sabha is the lower house of the Parliament.
- The fee is actually a deposit. It is returned to the candidate if they manage to obtain 1/6th of the total number of votes. For independents the deposit amounts to a fee in practical terms. Between 1977 and 2004, approximately 96% of the independents in our primary sample forfeited the deposit.
- The control group is identical to all other subjects under examination except for the fact that it does not receive the ‘treatment’ or experimental manipulation that the treatment group receives.
- Standard deviation is a measure that is used to quantify the amount of variation or dispersion of a set of value.
- One standard deviation amounts to 12.50 candidates.
Further Reading
- Asher, Samuel and Paul Novosad (2017), “Politics and Local Economic Growth: Evidence from India”, American Economic Journal: Applied Economics, 9(1): 229-273. Available here.
- Kapoor, Sacha and Arvind Magesan (2018), “Independent Candidates and Political Representation in India,” American Political Science Review, 112(3): 678-697. Available here.
- Khemani, Stuti (2017), “Does delegation of fiscal policy to an independent agency make a difference?”, Journal of Development Economics, 82(2): 464-484.

By: Shyam 13 March, 2022
Very informative article. Kudos to the researchers of this article and the writers for upholding the simplicity.