

 25 May, 2022


Value-added tax (VAT) systems have grown popular in the last 30 years, especially among developing countries looking for ways to raise tax revenue efficiently. Using 2000-2012 data on product-, state-specific, and firm-specific tax rates, this article examines the staggered adoption of VAT across states between 2003 and 2008 on firms. It finds that the VAT reform increased firm sales by 45% within four years of the reform.
Economists tend to favour a value-added tax (VAT) system to a sales tax system (Crawford et al. 2010). Typically, VAT lowers supply-chain distortions and reduces double taxation (cascading) relative to most sales tax systems (Keen 2014). Under a VAT system, firms only pay taxes on the value added in production1. Additionally, firms have an incentive to truthfully report their input purchases to receive a tax credit, which functions as a check on reported sales by suppliers and makes tax evasion more difficult. These features have made VAT systems an increasingly popular tax in the last 30 years, especially among developing countries looking for ways to raise tax revenue.
But in practice, the features of most VAT regimes across the world differ substantially from the ideal VAT – which is broad based, features a single rate on all products, and is highly centralised. This real-life tax design could reduce the benefits of switching from a sales tax to a VAT. Although empirical studies are necessary, empirical evidence on the total effect of a transition from a sales tax to a VAT is limited. The adoption of state VAT systems in India in the mid-2000s provides a rare opportunity to explore the net benefits of such a reform.
The pre-reform sales tax regime and the reform process
In most Indian states, the sales tax system was originally adopted in the 1940s or 1950s2. The 1994 Bagchi Report, drafted by a group of Indian tax experts led by Amaresh Bagchi, at the request of the Ministry of Finance, referred to the commodity tax system as “archaic, irrational and complex – according to knowledgeable experts the most complex in the world” (Bagchi et al. 1994). The system created numerous production inefficiencies, with an estimated 35-40% of revenue coming from products already taxed at a prior stage of production (Poddar and Ahmad 2009). State systems also differed widely due to a mixture of administrative convenience, ad hoc measures to increase tax revenue, and tax competition between the states. To deal with these concerns, the Bagchi Report recommended a switch from the state sales tax regime to a state-level VAT system as the most realistic step towards a more efficient commodity tax system.
Implementing such a large reform required the support of state governments, but many states were concerned about the potential loss of revenue from the move to a completely new tax system. This led to delays in the process and, ultimately, to a VAT system that gave states important freedoms to shape their own systems, rather than implementing a harmonised system across states. Moreover, states maintained the ability to levy product-specific tax rates, including the ability to zero-rate (or remove) products from the tax base. Eventually, extraneous factors like the election schedule, the intensive legislative process, and administrative changes required for the reform led to the staggered adoption of VAT across states between 2003 and 2008 (Hoseini and Briand 2020).
Comparing the complexity of state-specific commodity tax systems
The complexity of the state-specific commodity tax systems creates empirical challenges. Before and after the reform, tax rate information for each state was published in long lists of commodities, with their specific rates listed in tax rate schedules. These documents often included hundreds or thousands of itemised products, in addition to a default tax rate which applied to all goods not explicitly mentioned in the schedules. Product descriptions and categories were also adjusted over time as new products were added or removed, or as descriptions were made more precise. We construct a comprehensive dataset of these product- and state-specific tax rates before and after the VAT adoption ranging from 2000 to 2012. The primary sources of these taxes are tax laws and tax rate-change notifications from Commerical Law Publishers (2000, 2002) and the websites of state Commercial Taxes Departments, which we digitise and harmonise.
Figures 1 and 2 provide a snapshot of the complexity of the two tax systems using our database at three points in time.
Figure 1. Number of unique tax rates, by state, over time
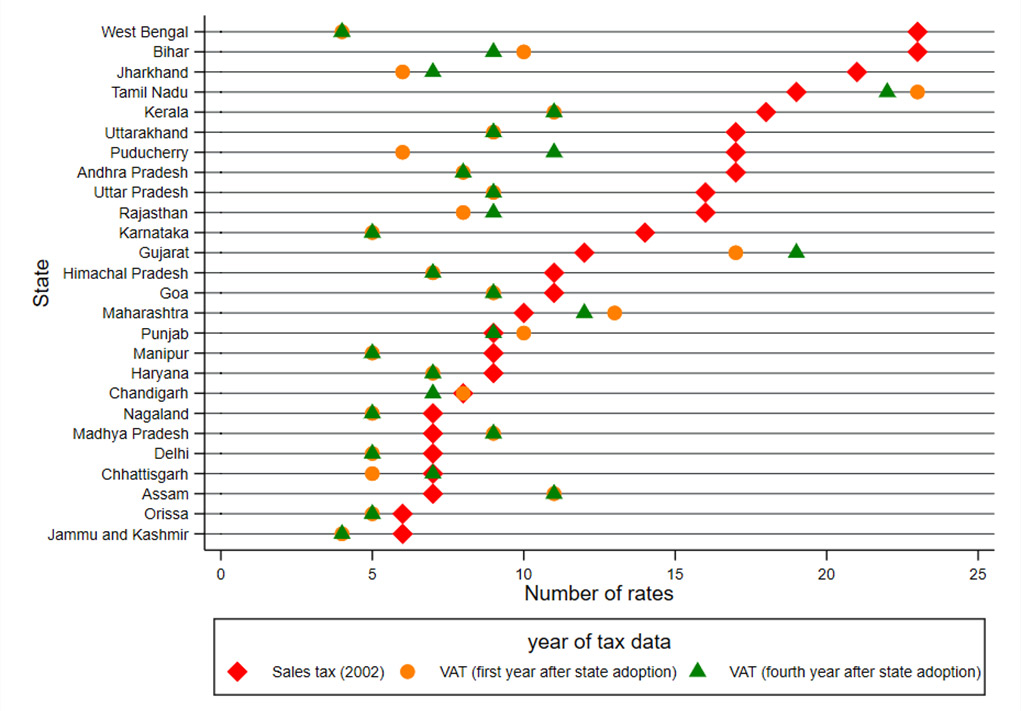
Note: (i) The red diamonds indicate pre-reform sales tax data in 2002, before any state switched to a VAT; the orange circles indicate data for the first year of the VAT in each state; and the green triangles indicate data for the fourth year after the reform in each state, which corresponds to the latest time period that we can study with the firm data that we use.
Figure 2. Number of items, by state, over time
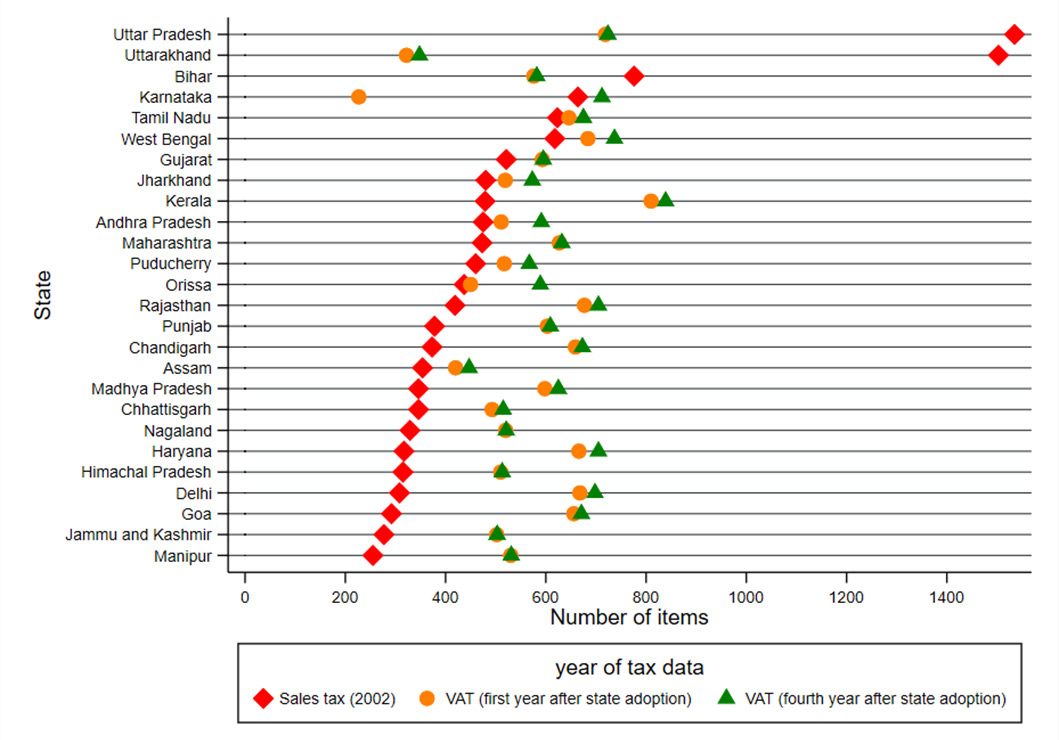
Figure 1 shows that the VAT reform was associated with a large drop in the number of unique tax rates in many states, suggesting a reduction in the complexity of the system. However, at the same time, Figure 2 shows that most states became more detailed in their tax-rate schedules, by explicitly listing more products.
Impact of the reform on firms
In a recent study (Agrawal and Zimmermann 2022), we examine how VAT adoption affected the typical manufacturing firm. We combine our tax database with 1998-2012 firm-level data from the Annual Survey of Industries (ASI). As the ASI data contain detailed information on the specific inputs used by firms in their production process, we can create the average tax rate for each firm on inputs and outputs. The data also allow us to explore the effect of the reform on firm sales, labour, and capital, among other factors.
The impacts of the reform are likely to be dynamic. To capture these effects, we use an event-study approach to visualise the changes in firm-specific tax rates over time3. The staggered adoption of the reform across states allows us to causally estimate the effects by comparing firms in states that had already adopted VAT, to firms in states that had not yet switched, in an extension of a difference-in-differences (DID) design4.
Figure 3 first shows that VAT adoption led to large declines in the effective input tax rate faced by firms. Holding production constant at pre-reform levels, that is, the year before the reform was adopted (year ‘-1’ in Figure 3), the figure shows that the average statutory tax rate of firms – weighted by the quantity of inputs a firm uses – dropped by about 1 percentage point in the first year of the reform (year ‘0’ in Figure 3). By the fourth year of the reform (year ‘3’ in Figure 3), the tax rate had declined by more than an additional percentage point. Compared to the pre-reform average input tax rate of 7.31%, this constitutes a large tax decrease for the typical firm.
Figure 3. Impact of VAT reform on firm-specific statutory input tax rate
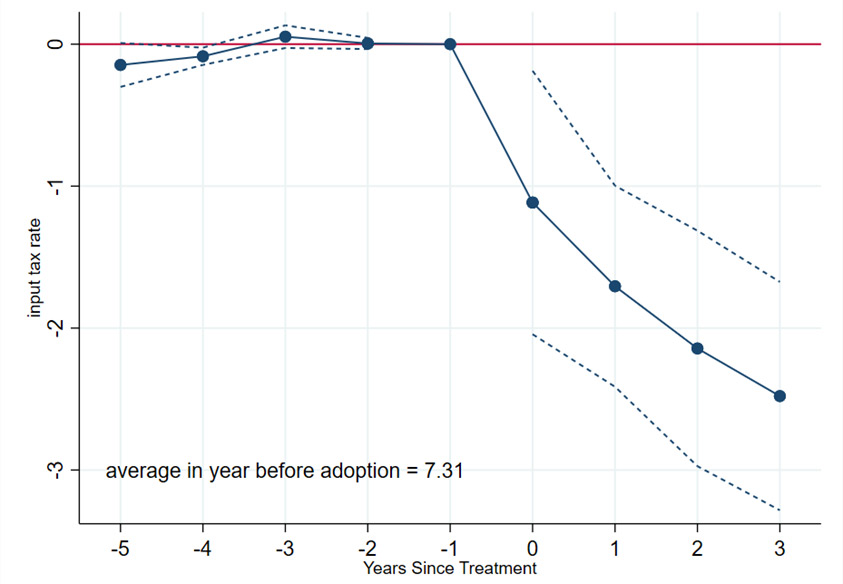
Notes: (i) The blue circles indicate average weighted tax on inputs at constant production. (ii) The dashed lines show 95% confidence intervals. A confidence interval is a way of expressing uncertainty about estimated effects. A 95% confidence interval, means that if you were to repeat the experiment over and over with new samples, 95% of the time the calculated confidence interval would contain the true effect.
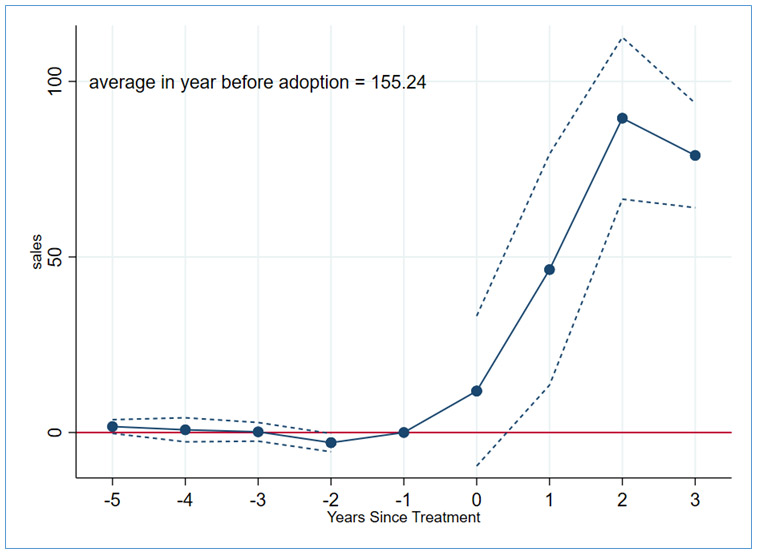
Turning to Figure 4, we find that firm sales increased by 45% relative to the pre-reform average four years after the reform5. This suggests that the VAT reform was highly beneficial for firm production. These increases in output are coupled with similar increases in material inputs.
Figure 4. Impact of VAT reform on firm sales (in million rupees)
When we divide firms into quartiles6 based on their pre-reform input tax rates, we find that firms with the lowest input taxes faced a tax rate increase due to the VAT reform. Nevertheless, even these firms realise substantial production gains. This suggests that the reductions in the complexity of the tax system and other elements of the VAT had efficiency-inducing characteristics. Thus, tax rates mattered, but perhaps more importantly, tax design is pertinent. Exploring other firm decisions, we find that the reform increased the earnings of workers and the amount of capital used in production, perhaps due to a relaxation of credit constraints.
Conclusion
As the GST nears its five-year anniversary in July, the national VAT system is still the subject of policy debate. This means that more research on the impacts of VAT and its specific design features is important. In our analysis of the move from state-specific sales tax to VAT systems in the 2000s, we conclude that the reform induced firms to be more productive and to better allocate resources in the production process.
Our results indicate clear advantages of the VAT to the sales tax, even when states maintain autonomy over aspects of tax design. Even in a highly decentralised system with product-specific tax rates and many zero-rated products, the VAT reform in India clearly benefitted firms. The adoption of state VATs in India was arguably the largest fiscal reform affecting firms in a long time, and our results indicate that the reform was important for economic growth. The gains to firms that we identify indicate the importance of VATs as an efficient way of raising revenue.
I4I is now on Telegram. Please click here (@Ideas4India) to subscribe to our channel for quick updates on our content
Notes:
- Value added in production refers to the difference between sales and the cost of purchased inputs.
- Some other states like Arunachal Pradesh and Mizoram, however, only introduced sales taxes much later. The union territories of Andaman and Nicobar Islands and Lakshadweep have never had a sales tax system.
- Event studies show the dynamic evolution of outcomes for a group that experiences a policy change like VAT adoption relative to comparison groups not experiencing the event at the same time.
- Differences-in-differences is a technique to compare the evolution of outcomes over time in similar groups, in this case where one experienced a policy change,while the other did not. Recent econometric literature has pointed out the concerns with estimating causal effects in such staggered D-i-D designs with the traditionally employed two-way fixed-effects specifications (Goodman-Bacon 2021). We use the method proposed by Gardner (2021) that resolves those problems.
- This translates into an elasticity of -1.6 with respect to the average effective tax change.
- If the pre-reform input tax rates of the various firms are listed in ascending order, the bottom quartile would refer to the bottom 25% of firms in terms of their pre-reform input tax rates.
Further Reading
- Agrawal, DR and LV Zimmermann (2022), ‘The Effects of Adopting a Value Added Tax on Firms’, Working Paper.
- Bagchi, A et al. (1994), ‘Reform of Domestic Trade Taxes in India: Issues and Options’, National Institute of Public Finance and Policy.
- Commercial Law Publishers (2000), Commercial’s All India Sales Tax Tariff: States Sales Tax Rates, Commercial Law Publishers, Delhi.
- Commercial Law Publishers (2002), Commercial’s All India Sales Tax Tariff: States Sales Tax Rates, Commercial Law Publishers, Delhi.
- Crawford, I, M Keen, and S Smith (2010), ‘Value Added Tax and Excises’, in S Adam, T Besley, R Blundell, S Bon, R Chote, M Gammie, P Johnson, G Myles, J M Poterba (eds.), Dimensions of tax design: The Mirrlees Review.
- Gardner, J (2021), ‘Two-Stage Differences in Differences’, Working Paper.
- Goodman-Bacon, Andrew (2021), ‘Difference-in-differences with Variation in Treatment Timing’, Journal of Econometrics, 225(2): 254-277.
- Hoseini, Mohammed and Oceane Briand (2020), ‘Production Efficiency and Self-enforcement in Value-added Tax: Evidence from State-level Reform in India’, Journal of Development Economics, 144: 102462.
- Keen, Michael (2014), ‘Lessons for the GST from International Experience: Possibilities and Pitfalls’, India Tax Insights, 3: 12-14.
- Poddar, S and E Ahmad (2009), ‘GST Reforms and Intergovernmental Considerations in India’, Government of India Working Paper 1/2009, Ministry of Finance, Department of Economic Affairs.

Comments will be held for moderation. Your contact information will not be made public.