

 12 July, 2021


India has seen a four-fold increase in average incomes since 1990, which has reduced the share of the population living in absolute poverty from 45% to 20%. Yet, there are large and widening inequalities in incomes and opportunities. Analysing microdata from the National Sample Survey, this article provides estimates of the ‘locational premiums’ that residents can earn merely by belonging to a richer sub-region.
In 2006, the World Bank set up a blue-ribbon ‘Commission on Growth and Development’ to understand why some countries achieve growth miracles and others fail. Reflecting on the findings, Michael Spence, who chaired the Commission, wrote that “perhaps the most important lesson was that growth patterns that lack inclusiveness and fuel inequality generally fail” (Spence 2018). Since the Commission’s work, India has joined the list of growth miracles, bearing out – and narrowly beating out – the forecast by Rodrik and Subramanian (2004) that India would grow at 7% per year annually for the next 20 years. The four-fold increase in average incomes since 1990 has lowered the share of the population living in absolute poverty from 45% to 20%, improving the lot of 130 million people.
Richer, but relatively poorer
While most segments of society have shared in this remarkable performance, inequality in incomes within India remains large. Incomes in a poor state like Bihar, despite its strong growth in recent years, are only about 15% of those in the national capital of New Delhi – a gap of the same order of magnitude as that between Indian and US average incomes.
Figure 1a. Lack of convergence in incomes among Indian states, top-five versus bottom-five states
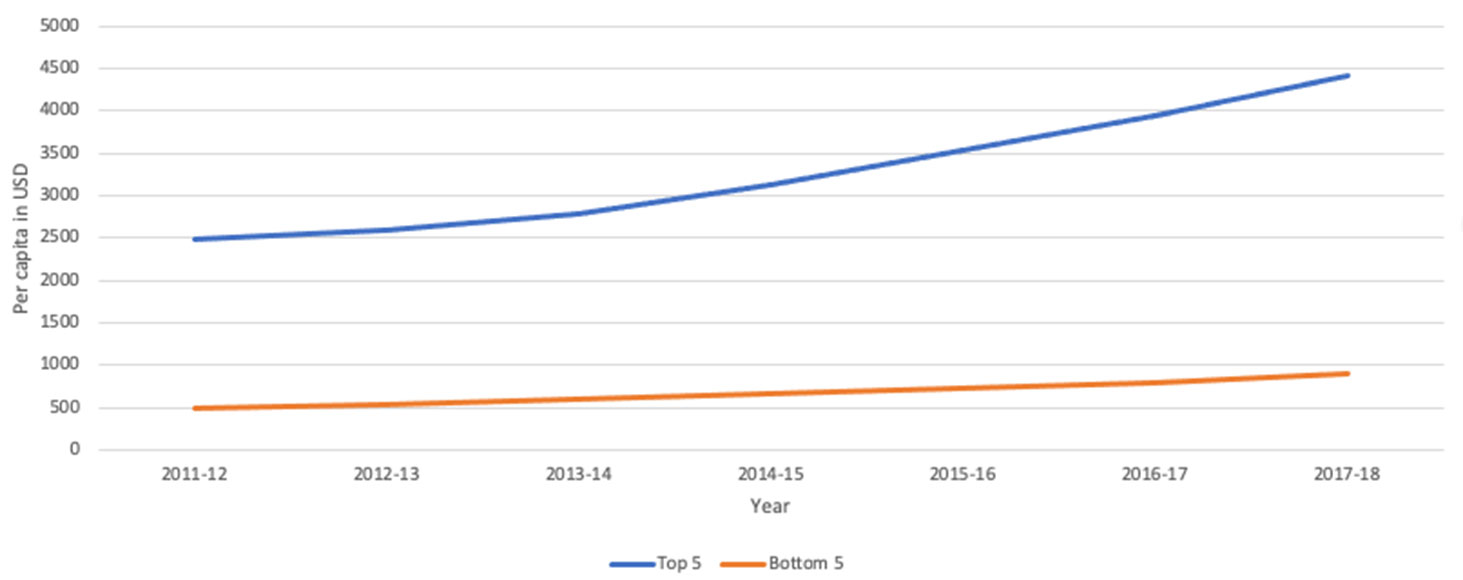
Note: The figure depicts the top-five versus bottom-five Indian states in terms of average per capita income.
Figure 1b. Lack of convergence in incomes among Indian states based on income growth
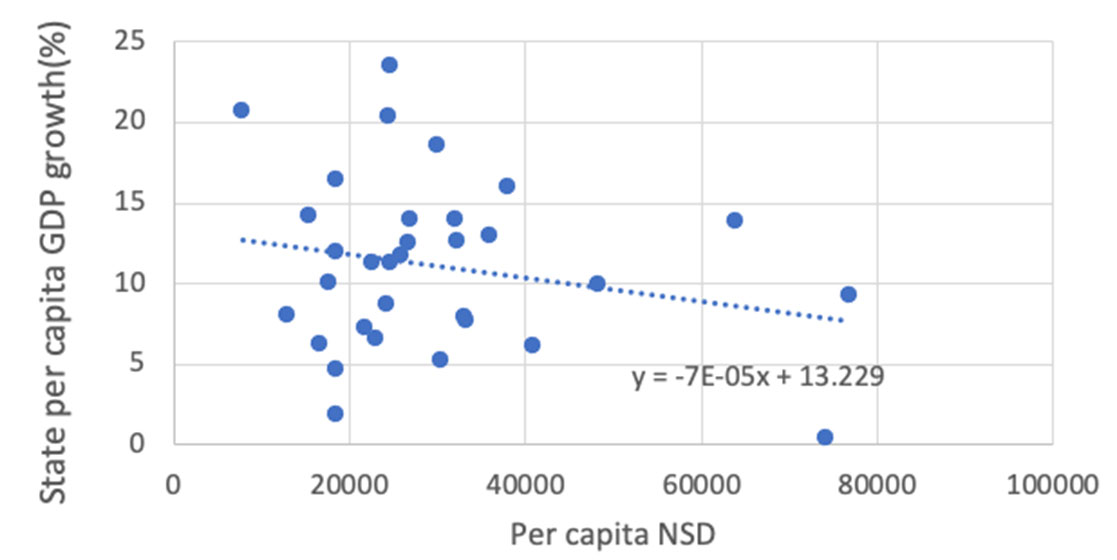
Notes: (i) The figure depicts state income growth between 2004 and 2015 against 2004 level of income. (ii) NSD refers to net state domestic product.
Source: Government of India data, and authors’ calculations.
The gulf between the top-five richest states and the poorest-five states widened between 2011 and 2018 (Figure 1a)1. Looking across all states, there was essentially no catch-up between 2004 and 2015 – states that were rich in 2004 have grown at about the same rates as those that were poor (Figure 1b). This divergence partly reflects differences in initial investment levels in infrastructure and schooling, which may have continued to confer advantages to the leading states (Bhalla 2011).
The gap between urban and rural incomes has also widened. Average incomes in urban India are twice that in rural India, which is still home to 70% of the population. To understand urban-rural income trends better, in new research (Balasubramanian et al. 2021) we use microdata from the nationally representative consumer expenditure surveys conducted by India’s National Sample Survey Office (NSSO) to calculate annual real per capita consumer expenditure – our indicator of living standards. Separate price indices are used for urban and rural areas to account for cost differentials (for example, in housing). The NSSO data are widely used in studies of India’s income distribution in the absence of regular income surveys. While income tax data have also been used (Chancel and Piketty 2019), these cover less than 5% of the population, and do not include agricultural incomes which are not taxed. For comparisons over time and with other countries, we use the World Bank’s PovCalNet database, which merges and standardises surveys to permit a more consistent measurement of living standards across countries.
Figure 2 shows growth incidence curves (GICs) for urban and rural deciles2 of the population for the 2004-2011 period3. If consumption growth is equal for all deciles, the GIC should be flat; an upward-sloping GIC indicates higher growth among the richer deciles. Strikingly, the urban distribution is ‘non-linear’, with the highest growth rates accruing to the lowest four deciles and the top decile (the biggest gainer). The difference between the urban and rural deciles is also quite apparent. The lowest urban deciles experienced more consumption growth than most of rural India. This occurred despite an important policy innovation to help rural India – namely, the Mahatma Gandhi National Rural Employment Guarantee Act passed in 2005 (MNREGA), which guarantees every rural household 100 days per year of paid manual work at minimum wages in proximity to the household’s location.
Figure 2. Urban-rural wage gaps in India
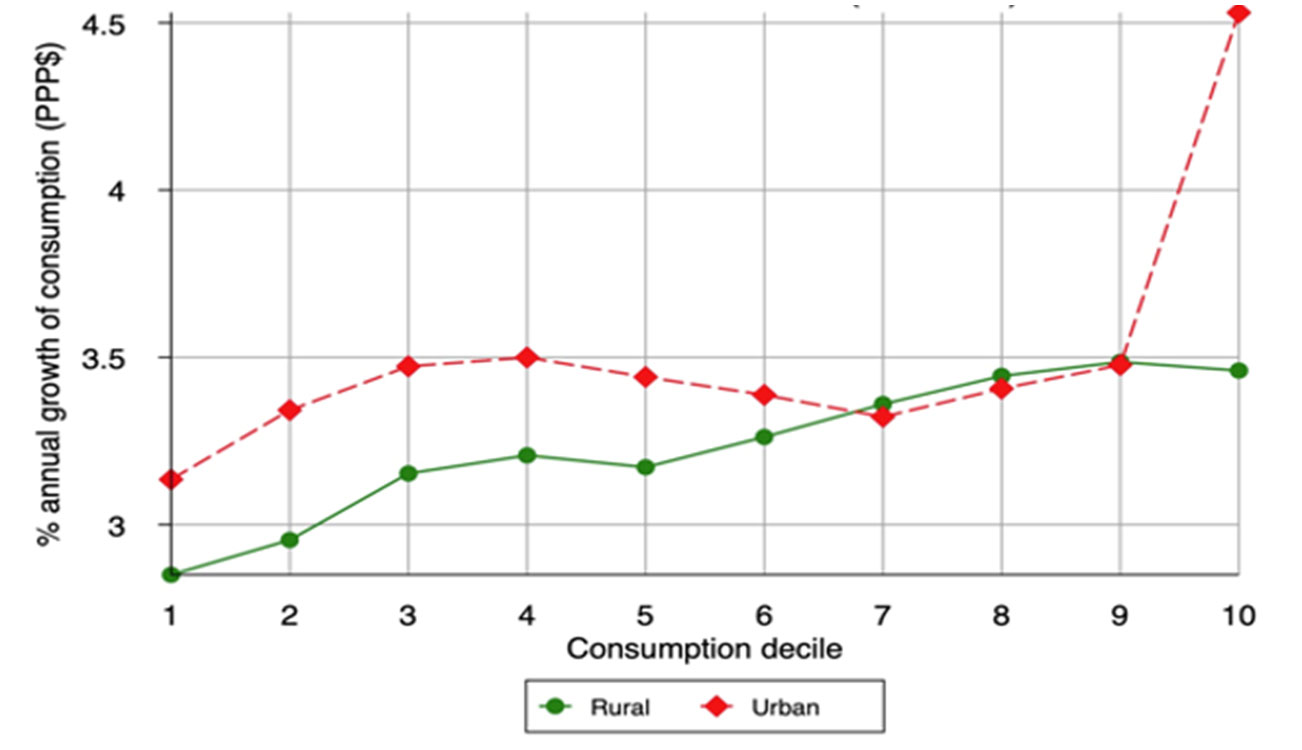
Notes: The red and green lines represent the growth incidence curves for urban and rural India, respectively, during 2004-2011.
Source: Authors’ calculations based on NSS data.
In our study, we provide estimates of the ‘locational premiums’ that residents can earn merely by belonging to a richer sub-region, that is, state and sector (urban versus rural). Our concept of a locational premium is motivated by the work of Milanovic (2015a, 2015b) on ‘citizenship premiums’ – that is, the additional income that a person earns simply because of the luck of being born into a rich country. Using microdata from household surveys, Milanovic shows that two-thirds of the variability in individual incomes across countries can be explained by just one variable – the country where people live. When we conduct a similar exercise for individual incomes within India, we find that 25-30% of the variability can be explained by location alone, despite the greater opportunities for migration within a country than is possible across countries. In short, our evidence suggests a substantial locational premium to being lucky enough to belong to a richer state in India or a richer sector (urban versus rural).
Welcome or worrisome?
Should such income disparities within India be a source of concern, or are they a welcome sign of structural transformation in the Indian economy? As the survey by Lagakos (2020) notes, “throughout time and space, economic development has been associated with massive population movements from rural to urban areas, and from agriculture to non-agricultural activities”. Indeed, countries in India’s peer group are all undergoing a similar transition. The experience of two of those countries, China and Indonesia, is illustrative (Figure 3). China is similar to India in having faster urban than rural growth, but the pattern in Indonesia is the reverse. In general, cross-country experience suggests that there is no set pattern of urban-rural income differentials during the transition, and country preferences and policy choices can play a determining role.
Figure 3. Growth incidence curves: China and Indonesia
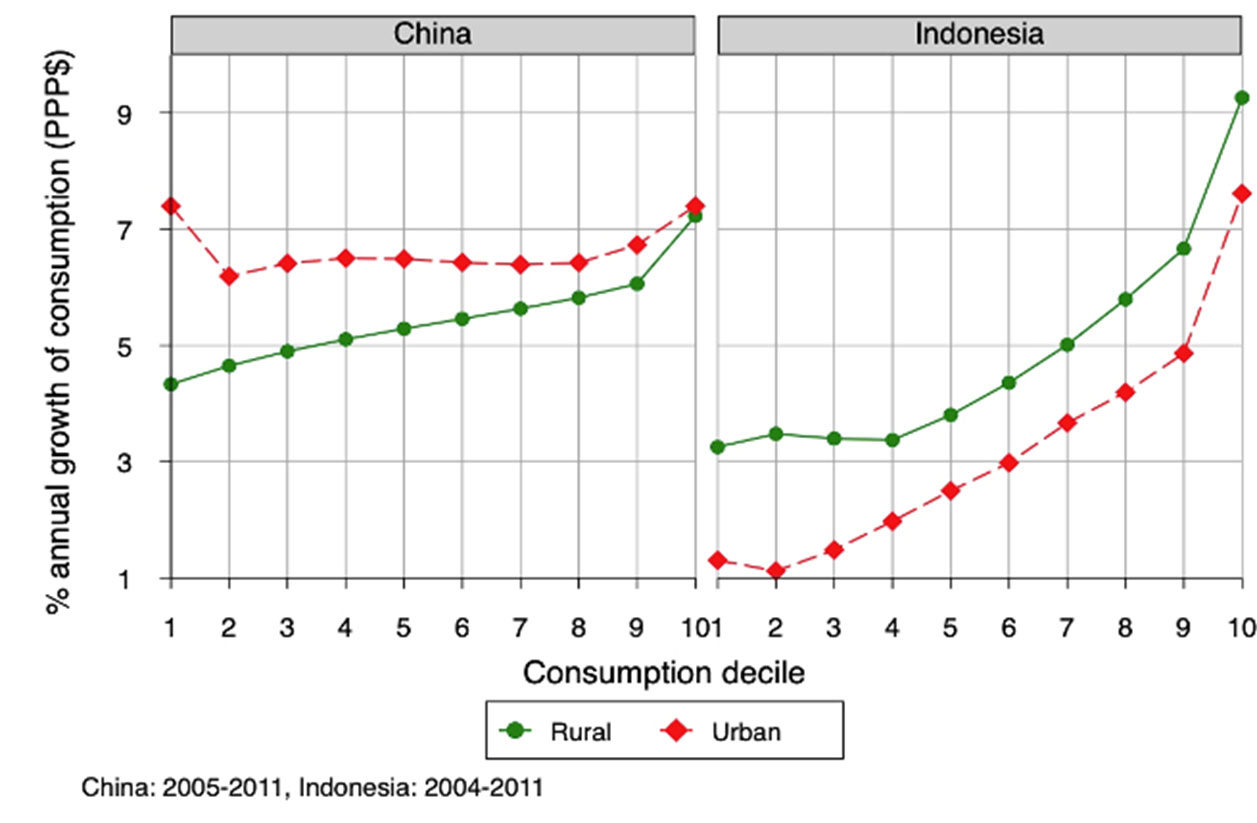
Source: Based on authors’ calculations; World Bank’s PovCalNet.
Just like urban-rural gaps, inter-state differentials might also be welcomed as a sign of the increased dynamism of the Indian economy. While highlighting distributional considerations as one of the risks to their forecast on India’s growth, Rodrik and Subramanian (2004) nonetheless argued that the disparity between states may reflect “a very powerful positive dynamic in India: namely, the competition among states to improve institutions and policies—a kind of race to the top”.
The Government of India’s latest Economic Survey appears to have come down on the side of not being overly concerned about inequality. It argues that the “policy objective of focusing on inequality may not apply in the Indian context” and that the “focus must continue on growing the size of the economic pie rapidly at least for the foreseeable future” to continue to lift the poor out of poverty (Government of India, 2021).
The international experience would suggest that a less sanguine approach may be prudent. As Spence (2018) noted, high inequality is one of the key factors that brings a growth miracle to an end (Ostry et al. 2019). The experience of Chile is a case in point. Edwards (2010) had presciently warned that inequality was the Achilles’ heel of the country’s growth miracle, but the dominant view among Chilean policymakers remained that an exclusive focus on growth remained appropriate. The social explosion in Chile in 2019 showed that what had worked “in a very poor nation was not appropriate in a country with a growing middle class” which wanted better government services, “more solidarity and fewer privileges for the elite” (Edwards 2019). Notably, inequality as measured by the commonly used Gini coefficient4 had declined in Chile, suggesting that sometimes it is only by looking beyond the Gini that the pressure points of societal tension can be detected.
Concluding remarks
Our findings suggest that increased attention among Indian policymakers to urban-rural and inter-state differentials in incomes and opportunities would be a prudent investment to help sustain the growth miracle. Beyond a point, the persistence of such differentials, even if absolute incomes are growing, can reflect a lack of opportunities for segments of the population and lead to disenchantment that the process generating the growth in average incomes is not fair. Long and Spence (2018) note that digital technology can be a powerful force for fostering inclusive growth patterns in developing economies. Hence, in trying to redress excessive inequalities in opportunities and incomes, India can leverage the use of the digital technology in which it has excelled. Indeed, in recent years, various direct benefit transfer schemes in India have already proven to be quite successful in improving targetting of assistance to low-income deciles. Moreover, its strategies to empower semi-rural and semi-urban cities through the ‘Smart Cities’ campaigns could further spread out the opportunities from urban areas to semi-rural and urban areas to enhance inclusive growth. Addressing inequality of opportunity is likely to be a win-win for sustaining the growth miracle and ensuring that it is inclusive and equitable.
This article first appeared on VoxEU.
I4I is now on Telegram. Please click here (@Ideas4India) to subscribe to our channel for quick updates on our content.
Notes:
- This does not include the 1.5 million population filter we have in our paper.
- A decile measure ranks and divides the dataset into 10 equal parts such that, if values of consumption are listed in ascending order, the bottom decile would refer to the bottom 10% values in terms of consumption.
- The latest year for which the microdata have been officially released is 2011.
- Gini coefficient is a measure of statistical dispersion, mainly used to enumerate income inequality. It is measured on a scale of 0 to 1; with 0 indicating perfect equality and 1 indicating maximal inequality.
Further Reading
- Balasubramanian, S, R Kumar and P Loungani (2021), ‘Inequality and locational determinants of the distribution of living standards in India’, IMF Working Paper 2021/050.
- Bhalla, SS (2011), ‘Inclusion and growth in India: some facts, some conclusions’, LSE Research Paper.
- Chancel, Lucas and Thomas Piketty (2019), “Indian income inequality, 1922-2014: From British Raj to Billionaire Raj?”, Review of Income and Wealth, 65(S1): 33-62.
- Edwards, S (2010), Left behind: Latin America and the false promise of populism, University of Chicago Press, Chicago.
- Edwards, S (2019), ‘Chile’s insurgency and the end of neoliberalism’, VoxEU, 30 November.
- Deaton, Angus and Jean Drèze (2002), “Poverty and inequality in India: a re-examination”, Economic and Political Weekly, 37(36): 3729-3748.
- Jaffrelot, C and A Kalaiyarasan (2021), ‘How India has become an unequal republic’, Mint, 27 January.
- Government of India (2021), ‘Inequality and Growth: Conflict or Convergence’, Economic Survey.
- Long, C and M Spence (2018), ‘The Digital Key to Inclusive Growth’, Project Syndicate, 29 November.
- Milanovic, Branko (2015a), “Global Inequality of Opportunity: How Much of Our Income Is Determined by Where We Live?”, Review of Economics and Statistics97(2): 452-460. Available here.
- Milanovic, B (2015b), ‘Income inequality and citizenship: Quantifying the link’, VoxEU, 6 May.
- Patnaik, I (2020), ‘Why migrant workers are starting to return to cities & how this can revive economy faster’, ThePrint, 5 June.
- Sharma, K (2017), ‘India has 139 million internal migrants. They must not be forgotten’, World Economic Forum, 1 October.
- Spence, M (2018), ‘How Inequality Undermines Economic Performance’, Project Syndicate, 26 December.

Comments will be held for moderation. Your contact information will not be made public.