

 24 June, 2019


Dowry payments are an important part of household finances in India, typically exceeding a year of earnings. This article analyses data from an all-India sample of over 70,000 marriages to document facts about the evolution of dowry in the country over the 20th century. It empirically tests various theories of dowry and finds that dowry is best explained by the ‘returns’ to marrying a particular groom.
One of the most significant financial transactions for Indian households occurs at the time of marriage. Dowry – transfers from the household of a bride to that of her groom – is nearly universal in contemporary India, and typically exceeds a year of earnings. The Government of India considers the payment of dowry to be a major social ill, but its legislative efforts to eliminate dowry have proven ineffective. Moreover, extensive research has documented how dowry can encourage sex-selective behaviour (Bhalotra et al. 2016, Borker et al. 2017, Alfano et al. 2017), cause violence against wives in hopes of extracting further dowry payments (Bloch 2002) and alter investment decisions of households (Vogl 2013, Anukriti et al. 2019).
In economics, there is a rich theoretical literature on dowry, with a number of models providing possible explanations for why dowry exists. Yet there is surprisingly little quantitative evidence testing whether those explanations match ground realities, or showing how dowry has evolved in India over time. The aim of our analysis (Chiplunkar and Weaver 2019) is two-fold: first, we use a number of datasets to document facts about the evolution of marriage practices and dowry in India over most of the 20th century. Second, we use these data to empirically test various theories on the evolution of dowry. Understanding the root causes of dowry is useful in designing appropriate policy responses.
We use three primary datasets for information on marriage practices and dowry payments: (a) Rural Economic and Demographic Survey (REDS)1, which contains information on 72,093 marriages across India between 1930 and 1995, including dowry payments; (b) Indian Human Development Survey (IHDS); and (c) National Family Health Surveys (NFHS). Both IHDS and NFHS are multi-round, nationally representative surveys.
Evolution of marriage practices in India
As has also been shown in other work, some Indian marriage practices experienced only minimal changes over the course of the 20th century:
- Even today, over 90% of marriages are “arranged” by the parents of the couple, as has been the case historically. However, the fraction of marriages in which members of the couple have some say over who their partner is has doubled from around 20% in 1960 to 40% by 2005.
- Marriages are concentrated within small geographical areas. 80% of brides marry grooms who reside within the same district, and the average travel time between the houses of brides and grooms is approximately three hours.
- As has been the case historically, 95% of marriages are between individuals of the same jati (sub-caste group). The rate of inter-caste marriage in rural areas is approximately the same now as it was in 1950, while in urban areas it has only increased by around 2 percentage points.
Prevalence of dowry
While some marriage practices have not changed, there have been substantial changes in dowry practices over the last century. As shown in Figure 1 below, dowry was paid in only around 40% of marriages prior to 1940. During 1940-75, there was a rapid adoption of dowry across India and by 1975 dowry was paid in nearly 90% of marriages.2
Figure 1. Prevalence of dowry during 1930-1995
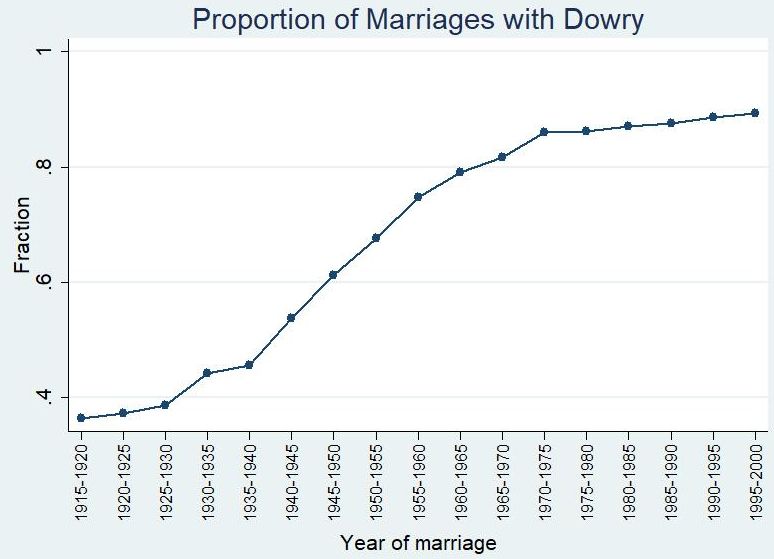
Other papers, particularly in sociology, have presented anecdotal or ethnographic evidence that dowry is more prevalent than in previous eras (Caldwell 1983, Srinivas 1984), but no data for a quantitative assessment of the magnitude of this trend.
Evolution of dowry payments
As dowry became more prevalent, the average size of dowry payments simultaneously increased. Between 1940 and 1970, the median dowry payment more than tripled in real terms, growing from approximately Rs. 5,000 to over Rs. 15,000 (as valued in 2010 rupees). Since 1970, the median dowry payment has remained roughly the same in real terms, contrary to the popular perception of widespread dowry growth.3 However, focusing solely on the median masks significant changes that have occurred throughout the distribution of dowry payments.
Figure 2 below shows a density plot of the entire distribution of real dowry payments for each decade between 1940 and 2000. The height of the curve represents the proportion of marriages in a particular decade that experienced a dowry of that amount. The evolution of dowry payments can be broadly divided into two phases:
Pre-1970: As shown in Figure 2a, there is an increase in dowry payments throughout the distribution during 1940-70, a phenomenon labeled by previous researchers as “dowry inflation” (Caldwell 1983, Rao 1993). Almost the entire distribution of dowry payments shifts to the right throughout this time period, indicating that individuals of all socioeconomic statuses experienced a rise in dowry amounts.
Post 1970: The conventional wisdom is that the magnitude of dowry payments continued to increase through the present day. However, as shown in Figure 2b, the pattern is actually more subtle. The lower tail of the dowry payment distribution scarcely changes, indicating that lower socioeconomic status individuals did not experience much change in dowry payments through this period. However, there is also a substantial decline in dowry in the upper percentiles of the dowry distribution, indicating that wealthier households began paying and receiving smaller dowries in the post-1970 period.
Figure 2. Evolution of dowry payments during 1940-2000
2a. 1940-1980 2b. 1970-2000
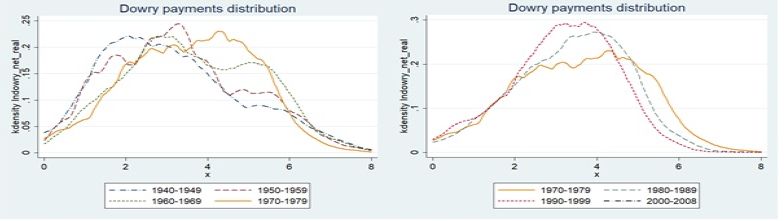
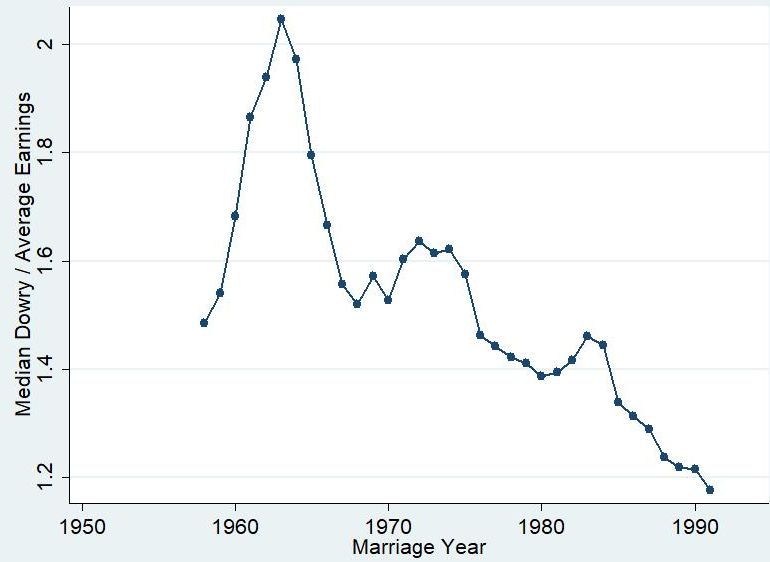
Figure 3 below examines how dowry payments change as a fraction of annual household income4. The decline in dowry payments observed in Figure 2b is consistent with dowries declining as a fraction of household income as well. However, dowry payments are quite substantial and the median dowry payment is still above the average annual income.
Figure 3. Dowry as a fraction of annual household income
Bring data to test theories on the evolution of dowry
We next investigate four prominent theories on the evolution of dowry in India using our data.
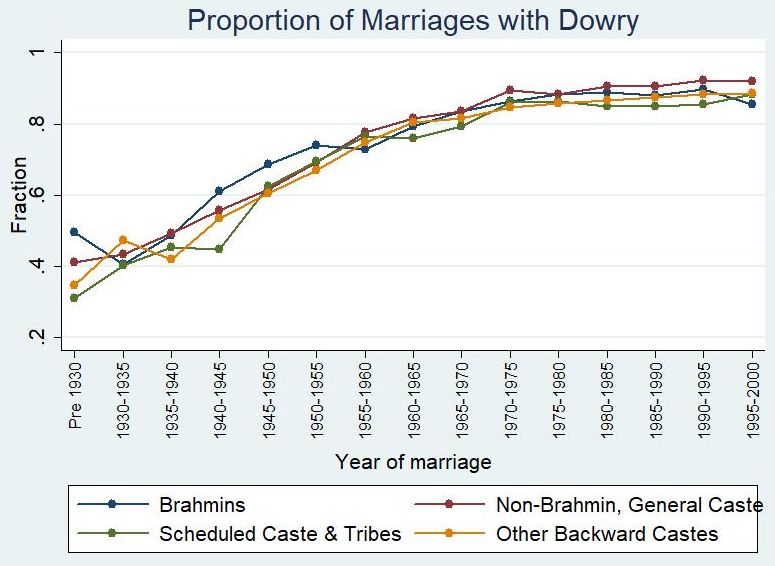
“Sanskritisation”: A well-known explanation for changes in dowry prevalence is the Sanskritisation hypothesis of Srinivas (1984). The theory proposes that dowry was always practiced among the upper castes, and spread as lower castes began to emulate the upper castes. This emulation is attributed to low-caste groups attempting to increase their social status (‘Sanskritise’) by emulating practices of high-caste groups. Figure 4 below shows that this theory cannot explain the rise of dowry. Both low- and high-caste groups began wide-scale adoption of dowry at around the same time and rates.
Figure 4. Dowry payments across broad caste groups
Sex ratios and dowry: Another theory rationalises changes in dowry as the result of changes in sex ratios due to population growth (for example, Rao 1993, Billig 1991, 1992, Dalmia et al. 2005, Sautmann 2011). Men marry at older ages than women, so when population grows, as was the case in India in the 1950s and 1960s, there will be a surplus of women at marriageable ages relative to men at marriageable ages. In the resulting “marriage squeeze”, competition over relatively scarce grooms may cause an increase in dowry. Contrary to these predictions, we do not find that sex ratio in the marriage market is related to increases in the prevalence or size of dowry. Instead, the “squeeze” appears to be relieved by changes in the age of marriage, with a smaller average age difference between brides and grooms, as shown theoretically in Anderson (2007).
Modernisation, economic growth, and dowry: Anderson (2003) links dowry inflation to increases in wealth dispersion during modernisation, alongside cross-caste competition over grooms. A key element of the theory is that families prefer to marry their daughters to men of higher caste status, with a strong preference against marrying men of lower castes. This cross-caste competition over grooms, combined with increased dispersion in groom quality, leads to dowry inflation (see paper for further details of the model). We empirically test one of the key predictions of this model that increased dispersion in groom quality among lower castes will lead to dowry inflation among higher castes. We do not find evidence of this type of cross-caste competition, likely since households actually prefer marrying within their own caste group rather than with those of higher caste status (Banerjee et al. 2013).
Dowry and groom ‘quality’: We provide evidence that the rise of dowry can be attributed to increased differentiation in groom quality during the process of modernisation, consistent with the theoretical model of Anderson and Bidner (2015). Starting in the 1930s and 1940s, primary education became more widely accessible and a class of better paid, salaried positions became available to Indian men. More educated or wealthy grooms may command higher dowries since those characteristics are valued in the marriage market. As the numbers of high-quality grooms increase, this could cause inflation in dowry amounts.
Using variation in dowry payments between immediate family members on the marriage market within the same five-year period, we establish that the ‘quality’ of a groom is a crucial determinant of the dowry they receive. Since almost everyone marries within their own caste group, we take advantage of this segmentation of the marriage market to demonstrate that this is not due to the groom's relative ranking in their caste group, but a return to the absolute years of education that they have completed. With this absolute return to education, dowry inflation should occur alongside the observed increases in groom quality.
One remaining question is why there is a decline in larger dowry payments in the post-1975 period. We show that this is because marriage markets are best characterised by a “search model” in which potential grooms and brides are matched and bargain over dowry. If the potential bride and groom agree on a dowry, they marry; if not, they do not marry and rematch with other partners. Higher quality grooms will receive higher dowries because brides have a higher utility from matching with them, and so brides prefer to match with them at high-value dowries rather than re-match. However, as the proportion of higher quality grooms increases, there is a higher probability of a bride meeting a high-quality groom if she rematches. As a result, the dowries that high-quality grooms receive go down, consistent with a decline in higher value dowries (see model in the paper). We find this exact pattern in the data: as the pool of educated grooms in an area increases, this decreases the dowry premium that more educated grooms receive. While similar to the model of Anderson and Bidner (2015), the search model better explains the full trajectory of dowry payments over the past century.
Conclusion
Over the last century, while some aspects of Indian marriages have remained the same (such as low rates of inter-jati marriage), others have evolved significantly. Our research focuses on the evolution of dowry payments, and how they came to become a substantial financial transaction for most Indian households. We also show how a simple model of marriage markets, based on the returns to marrying a particular groom, can explain the timing and type of changes observed. Future work should focus on applying these insights to policy, and considering interventions that may alleviate the most malignant consequences of dowry.
Notes:
- The REDS provide retrospective data on marriages in a household. See the paper for an extensive discussion on the data.
- There is substantial geographical variation in the adoption of dowry: while some states such as Himachal Pradesh and Madhya Pradesh had high rates of payment even in the 1930s, most had much lower rates of dowry prevalence at that point. See the paper for state-wise patterns of adoption.
- Dowry amounts have increased substantially in nominal terms, so this perception may be attributable to “money illusion” (Shafir et al. 1997).
- Household incomes are the average household incomes for a state calculated using multiple rounds of the National Sample Surveys during 1960-1990.
Further Reading
- Alfano, Marco (2017), “Daughters, Dowries, Deliveries: The Effect of Marital Payments on Fertility Choices in India”, Journal of Development Economics, 125, 89–104.
- Anderson, Siwan (2003), “Why Dowry Payments Declined with Modernization in Europe but are Rising in India”, Journal of Political Economy,111(2), 269–310.
- Anderson, Siwan (2007), “The Economics of Dowry and Brideprice”, Journal of Economic Perspectives, 21 (4), 151–174.
- Anderson, Siwan (2007), “Why the Marriage Squeeze Cannot Cause Dowry Inflation”, Journal of Economic Theory, 137 (1), 140–152.
- Anderson, Siwan and Chris Bidner (2015), “Property Rights over Marital Transfers”, The Quarterly Journal of Economics, 130, 1421–1484.
- Anukriti, S, S Kwon, and N Prakash (2019), 'Dowry: Household Responses to Expected Marriage Payments' Working Paper.
- Banerjee, Abhijit, Esther Duflo, Maitreesh Ghatak, and Jeanne Lafortune (2013), “Marry for what? Caste and mate selection in modern India”, American Economic Journal, Microeconomics, 5(2), 33–72. Available here.
- Bhalotra, S, A Chakravarty, and S Gulesci (2018), ‘The Price of Gold: Dowry and Death in India’, IZA DP No. 9679.
- Billig, Michael S (1991), “The Marriage Squeeze on High-caste Rajasthani Women”, The Journal of Asian Studies, 50(02), 341–360.
- Billig, Michael S (1992), “The Marriage Squeeze and the Rise of Groomprice in India’s Kerala State”, Journal of Comparative Family Studies, 197–216.
- Borker, G, J Eeckhout, N Luke, SMinz, K Munshi, and S Swaminathan (2017), 'Wealth, Marriage, and Sex Selection', Technical Report, Working Paper, Cambridge University.
- Botticini, Maristella and Aloysius Siow (2003), “Why Dowries?”, American Economic Review, 93 (4), 1385–1398.
- Bloch, Francis and Vijayendra Rao (2002), “Terror as a Bargaining Instrument: A Case Study of Dowry Violence in Rural India”, American Economic Review, 92 (4), 1029.
- Caldwell, John C, Palli Hanumantha Reddy, and Pat Caldwell (1983), “The Causes of Marriage Change in South India”, Population Studies, 37 (3), 343–361.
- Chiplunkar, G and J Weaver (2019), ‘Marriage markets and the rise of dowry in India’, Working Paper.
- Dalmia, Sonia and Pareena G Lawrence (2005), “The Institution of Dowry in India: Why it Continues to Prevail”, The Journal of Developing Areas, 38 (2), 71–93.
- Rao, Vijayendra (1993), “Dowry Inflation in Rural India: A Statistical Investigation”,Population Studies, 47 (2), 283–293.
- Sautmann, A (2011), 'Partner Search and Demographics: The Marriage Squeeze in India', Working Papers.
- Srinivas, MN (1984), 'Some Reflections on Dowry', OUP India.
- Vogl, TS (2013), 'Marriage Institutions and Sibling Competition: Evidence from South Asia', 1017–1072.

Comments will be held for moderation. Your contact information will not be made public.