

 10 May, 2021


Female labour force participation in India has been on the decline – dropping from an already low 29% in 2004-05 to 17% in 2017-18. However, the extent of women’s economic participation depends on how it is measured, and who is doing the measuring. In this context, this article uses survey data from four north Indian urban clusters, to demonstrate the role of instrument error – type of survey instruments used – and reporting error – the identity of the respondent.
One of the quintessential stylised facts about the Indian economy is the low – and declining – rate of female labour force participation (FLFP) in the country. But the extent of women’s participation in the workforce depends on how it is measured and who is doing the measuring.
India’s outlier status
Across countries, there is a well-known ‘U-shaped’ relationship between per capita income and FLFP (Goldin 1995). At very low levels of per capita income, women participate in the labour force in large numbers. But as incomes increase, women often withdraw from the labour force due to personal preferences, social and household pressures, or the inadequacy of suitable employment opportunities – stemming in part from the structural transformation from an overwhelmingly rural to a more urban society. As incomes and education continue to increase further, typically so does FLFP, as opportunities and norms ‘catch-up’ with larger structural changes.
India currently finds itself near the bottom of this U-shaped curve (Fletcher et al. 2018). What is striking, however, is how few women work in India even compared to countries with a similar level of per capita income. Female participation in the labour force has dropped from an already low 29% in 2004-05 to 17% in 2017-18, representing one of the worst gender gaps in the world (Sundari 2020).
How low is low?
Within India, however, there is an active debate regarding the actual severity of the female employment challenge. While there is little doubt that women’s economic empowerment leaves much to be desired, there are disagreements over the ‘true’ rate of FLFP. Some economists have argued that fewer women are working because more of them are attending (and remaining in) school (Bhalla and Kaur 2011). Anker et al. (1987) found that using a ‘keyword’ approach that focusses on questions related to ‘work’ or ‘activities’ as opposed to an ‘activity schedule’ that walks respondents through a series of major economic activities, understates the level of women’s work. Still others have argued that the decline in the quality of India’s statistical apparatus means that large national sample surveys likely underestimate the extent of women’s work by undercounting casual and domestic forms of labour.
Taking measurement error seriously
As part of an IGC research project (Kapur et al. 2021a), we explore the impacts of measurement error on women’s labour force statistics. Specifically, in a new paper we investigate two types of potential error – instrument error and reporting error – drawing on new survey data collected by the project team (during January-August 2019) from nearly 15,000 randomly sampled households across four north Indian urban clusters: Dhanbad (Jharkhand), Indore (Madhya Pradesh), Patna (Bihar), and Varanasi (Uttar Pradesh) (Kapur et al. 2021b).1
Instrument error
Instrument error pertains to the impact that the type of survey instrument employed might have on estimates of workforce participation. To investigate this, we compare definitions of ‘work’ across three separate modules of the survey: the household roster, the female primary respondent survey, and a separate time use survey. While the household roster is completed by any male or female adult (or combination of adults) in the household – the latter two must be completed only by a female primary respondent. By comparing across these three modules for each household in the dataset, we can estimate the degree of instrument-specific error that characterises data on FLFP.
Table 1 shows what labour force participation rates look like across these three instruments.
Table 1. Labour force participation rates across survey instruments
|
Gender of primary respondent/ Survey instrument |
Household roster |
Self-reported |
Time use |
|
Female |
18.5% |
22.3% |
20.2% |
|
Male |
95.8% |
82.2% |
91.3% |
Expectedly, the discrepancy between women and men’s labour participation rate is striking across all measures. The gap is more than 75% according to the roster. The gap is slightly smaller for the female primary respondent survey (22% for women versus 82% for men), while it is nearly just as high for the time use survey.
Although women are slightly more likely to report being engaged in work on the female primary respondent and time use surveys, the differences between self-reporting and the household roster are noticeable but not stark. In the most extreme case, 19% of women are listed as engaged in work as a primary activity on the roster, whereas 22% say they are working when self-reporting in the female-respondent surveys.
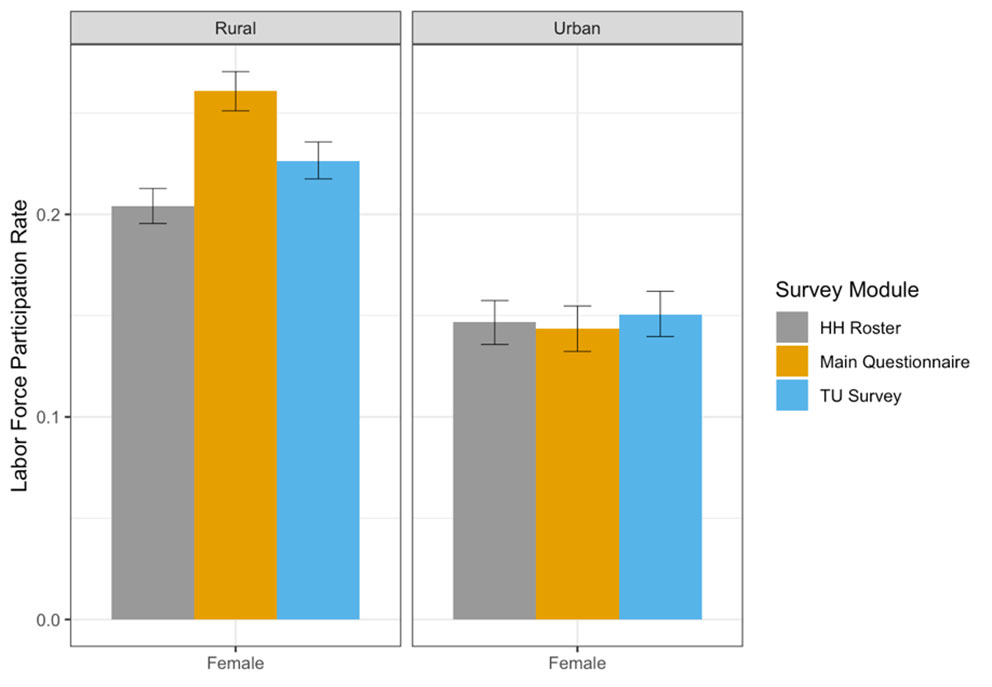
While the differences in FLFP across these three survey modules are statistically significant, this discrepancy is almost entirely concentrated in rural areas surrounding the four cities (Figure 1). This discrepancy could be the result of educational and cognitive differences or the varying nature of work in rural versus urban areas. Further investigation reveals that FLFP measures are the least consistent for women from households who own agricultural land, suggesting that the difference stems primarily from the fact that the work women do on the household farm is not reliably classified as ‘work’.
Figure 1. Rural-urban discrepancies in female labour force participation
Reporting error
The second type of error we consider is reporting error, or the idea that responses are conditional on the gender identity of the survey respondent(s). Here, we focus on the identity of the household member(s) completing the household roster – from which our data on labour market activity is collected. Previous work on survey methodology suggests that proxy reporting – when a respondent completes survey responses for another member of the household – tends to reduce reported labour force participation, and moreover, female proxies tend to report lower FLFP than male proxies (Bardasi et al. 2011).
To evaluate the impact of the gender identity of the respondent on reported FLFP, we examine how the gender composition of roster respondents impacts the reporting of women’s work. In 30% of households, multiple household members contributed to completing the household roster. In 53% of all households, the roster respondents are all-male; in 19% of households, they are all-female; and in 26% of households, they are evenly split. Our empirical analysis indicates that inconsistency in labour force reporting is highest when the roster respondents are all male, and lowest when roster respondents are all women (Figure 2).
Figure 2. Reporting inconsistency, by gender composition of household respondents
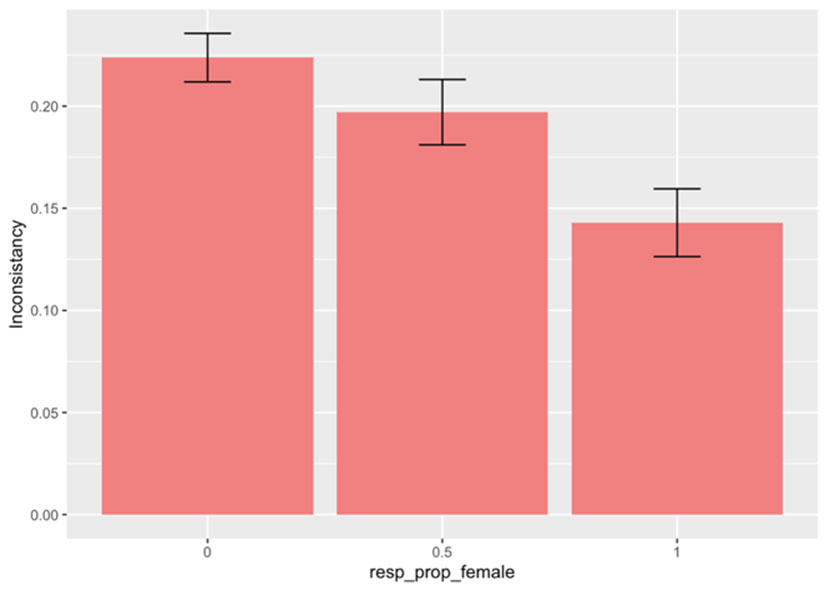
Contrary to Bardasi et al. (2011), we find that the gender identity of respondents matters – when the composition of roster respondents is mainly female, women’s participation in the workforce is more likely to be reported. Inconsistency in reporting declines by 5% as the composition of roster respondents becomes less male and more female. Furthermore, this effect holds even after controlling for education, rural/urban status, caste identity, assets, and city fixed effects.2 We also note that whether or not the female respondent herself fills out the roster data does not seem to matter. The crucial factor is that women are involved in filling out the household roster, suggesting that women can more accurately capture a given woman’s work status when compared to men in the same household.
Looking ahead
Governments around the world devote massive human and financial resources to carrying out large-scale surveys of the employment status of their citizens. But measurement potentially has an important gender dimension: how you measure, and who does the measuring – both have an impact on the data one collects. In the future, researchers – inside and outside of government – should devote special attention to these hidden, but important sources of bias.
I4I is now on Telegram. Please click here (@Ideas4India) to subscribe to our channel for quick updates on our content.
Notes:
- Our definition of an urban cluster captures the core city, small urban areas in the periphery, as well as peri-urban villages that are plausibly economically dependent upon the city. We used the polling booth area as the basis for our sample collection.
- Fixed effects control for time-invariant unobserved individual characteristics.
Further Reading
- Anker, Richard, ME Khan and RB Gupta (1987), “Biases in Measuring the Labour Force: Results of a Methods Test Survey in Uttar Pradesh, India”, International Labour Review, 126(2): 151-167.
- Bardasi, E, K Beegle, A Dillon and P Serneels (2012), ‘Do Labor Statistics Depend on How and to Whom the Questions Are Asked? Results from a Survey Experiment in Tanzania’, IZA (Institute of Labor Economics) Discussion Paper No. 4733.
- Bhalla, S and R Kaur (2011), ‘Labour Force Participation of Women in India: Some facts, some queries’, LSE Asia Research Centre Working Paper.
- Fletcher, E, R Pande and C Moore (2018), ‘Women and Work in India: Evidence and a Review of Potential Policies,’ Harvard Kennedy School Working Paper.
- Goldin, C (1995), The U-Shaped Female Labor Force Function in Economic Development and Economic History, University of Chicago Press.
- Kapur, D, M Vaishnav and D Verley, ‘What is Women’s Work? Reflections from Four North Indian Urban Clusters’, Working Paper.
- Sundari, S (2020), ‘Structural Changes and Quality of Women’s Labour in India’, The Indian Journal of Labour Economics, 63: 689-717.

Comments will be held for moderation. Your contact information will not be made public.