

 23 September, 2020


How can we best measure inter-caste tension and discrimination in India? In this post, Victoire Girard highlights the limitations of using statistics compiled under the Prevention of Atrocities Act, which was implemented in 1989 to combat caste-based discrimination. She documents that reported murders of lower castes, or even averaged responses regarding untouchability in household surveys, appear to provide more consistent proxies of inter-group tensions across states.
In order to combat caste-based discrimination, the Indian State implemented the Prevention of Atrocities Act, 1989 (henceforth, PoA Act). The Act focusses on offences related to the persistence of caste-based practices that are outlawed today, and the intentional humiliation of members of the lower castes. The PoA Act provides stronger punishment than what would be the penal code ruling, for a range of issues that are symbolically sensitive. For example, if a higher caste member denies access to a water source to a member of a Scheduled Caste/Tribe (SC/ST).1
As a result, an increase in the number of cases registered under PoA Act is often interpreted as a negative signal of caste-based discrimination and tensions. For example, the Union minister of state for social justice and empowerment recently cautioned Telangana government on the high number of cases booked under the Scheduled Caste and Tribes (Prevention of Atrocities) Act, 1989 after the state formation, and that the state has a much bigger number of cases compared to many bigger states.
However, as PoA Act cases depend on interactions between at least three actors, heightened tensions may not always translate in higher cases. The recording of a PoA Act case depends on not only the perpetration of the atrocity, but also the willingness of the victims to report, and of the police to record this atrocity – as stressed in Iyer et al. (2012) for crimes targeting women. Caste-based discrimination may prevent the recording of cases under PoA Act – for example, discriminatory behaviour by police officers may take the form of actively preventing the recording of offences, or an outburst of tensions may deter victims from trying to report the offences (Deswal 2013, Kumar 2015, Minj 2018).
Comparing findings from different measures of caste-based tension
This post builds upon data in Girard (2020), to contrast three different potential measures of the tensions related to the perpetuation of caste-based hierarchies: (i) caste-based murders,2 (ii) PoA Act offences, and (iii) survey declarations on untouchability.3
I use SC murders as a benchmark of the level of violence targeting members of the SCs. This approach, used in Aneja and Ritadhi (2020), Bros and Couttenier (2015), Girard (2020), and Iyer et al. (2012), is based on the idea that murder is the type of crime where the reporting bias is the lowest, if only because a body is hard to hide.
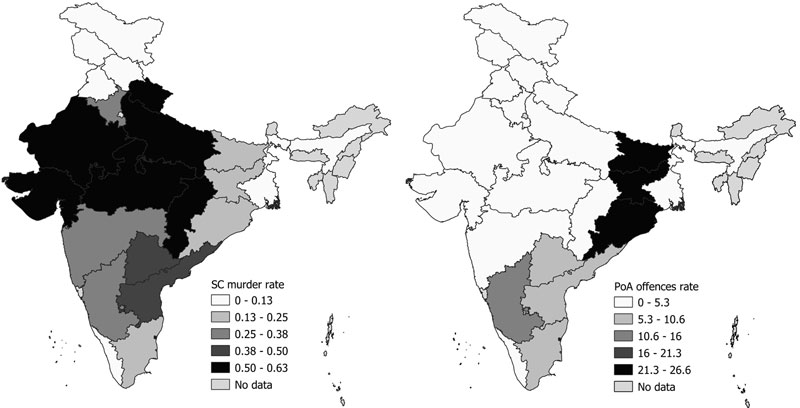
The visual representation in Figure 1 of the cases, as recorded by the police, casts doubt on the suitability of the use of the PoA Act cases as a measure of caste-based discrimination. PoA Act cases display no clear pattern, not even in states of the Hindi belt.4 In contrast, murder records are the highest in the states of the Hindi belt. Rajasthan, for example, records relatively few PoA Act cases, while it is one of the states witnessing the highest rate of murders per 100,000 members of the SCs.
Figure 1. SC murders and PoA offences, 2012
We can also check the police cases on PoA and murders against households’ survey responses about whether they either practise or have faced untouchability. Responses to these survey questions may be hard to interpret as they straightforwardly ask about a practice that has been anti-constitutional for more than half a century. We may worry that such straightforward questions on touchy subjects induce a social desirability bias in responses and the resulting data may not reflect ground realities well.
Unlike PoA Act cases, household survey responses on untouchability, when averaged by state, document a pattern strikingly consistent with that of caste-based murders. Figure 2 shows that untouchability practices are particularly widespread in the Hindi belt and are lower elsewhere. The Figure reveals a visual correlation between the share of non-SC/ST households that have declared that they practice untouchability and the share of SC households declaring that they suffer from untouchability.
Figure 2. Untouchability practice and victims across states
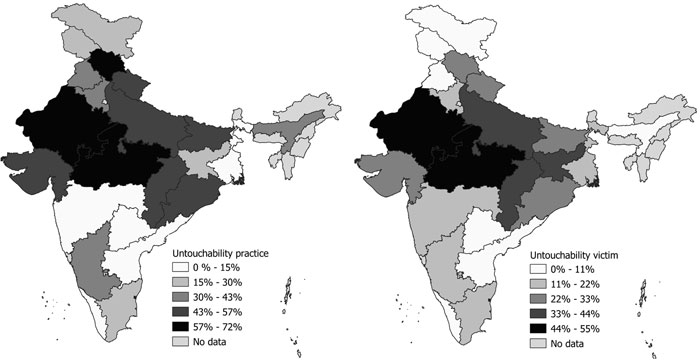
Note: The Figure shows percentage of non-SC/ST households who reported practicing untouchability, and percentage of SC households that reported being victims of untouchability.
On top of concerns with respect to social desirability bias in household responses, murders are a particularly extreme way of enforcing caste-based discrimination, and much more extreme than the daily practice of untouchability. We may thus expect the two behaviors to follow fundamentally different patterns. Yet, the murders and household survey measures appear to display a strong cross-sectional correlation.
For a statistical test of the visual correlations in the Figures 1 and 2, Table 1 displays the Spearman rank correlation matrix.5 Murder cases are positively correlated with households’ declaration on either perpetrating untouchability or suffering from untouchability practices. On the contrary, the PoA Act cases are not significantly correlated with either murder cases or households’ declarations.
Table 1. Correlation between police cases and household survey responses
|
Murders of |
PoA Act offences |
Practise untouchability |
Face untouchability |
|
|
Murders of SC members |
1 |
|||
|
PoA Act offences |
-0.042 |
1 |
||
|
Practice untouchability |
0.369 |
0.0009 |
1 |
|
|
Face untouchability |
0.484 |
0.131 |
0.698 |
1 |
Notes:
(i) The table displays the Spearman rank correlation matrix.
(ii) At the state level, the number of murders per 100,000 SC members in 2012 displays a correlation of 48.4 with the share of members of the SC who declare having faced untouchability practices, and this correlation is statistically significant at the standard 5% threshold. A significance level of 5% indicates a 5% risk of concluding that the strength of the relationship happened by chance if the null hypothesis were true.
(iii) The correlation between practice of untouchability and facing untouchability is significant at the 1% threshold.
Key takeaways
The set of comparisons above indicates three important facts:
(i) Murder cases and survey declarations consistently reveal variations in inter-caste tensions across states, which the PoA Act cases do not.
(ii) Statistics from offences recorded after the PoA Act should be interpreted with a lot of caution. To take an extreme illustration, these cases could be at similar levels in a place where there is almost no reporting to the police of highly prevalent discriminatory practices, and in another place where there is systematic reporting of the few instances of discriminatory practices.
(iii) State-level averages of two survey measures of untouchability practice and victimhood sheds new light on the prevalence of untouchability practices.
Notes:
- See Sharma (2015) for the complete list.
- Crucially, the National Crime Records Bureau of the Government of India maintains annual records of SC murders, which are recorded as such, if and only if : (i) the victim is from a SC , and (ii) the perpetrator is from a higher caste. Otherwise, the murder is recorded in the general crime category. SC murders are often interpreted as a signal of targeted caste-based violence, and indeed their evolution does not follow the evolution of other murders (Girard 2020).
- The murders and PoA statistics rest on First Information Reports (FIRs) filed at police station. Data are rescaled by 100,000 SC members to take in account for scale effects due to the size of the SC population. For comparability with survey responses, I focus on the year 2012, the pictures are similar when extending the time period to averages over 1992-2013. Survey declarations come from the Indian Human Development Survey of 2011-2012 ( Desai et al. 2015 ). Untouchability practice is equal to 1 if an household responses yes to either of the two questions: “do you practice untouchability?” or “do you mind an untouchable in your kitchen?”. I then compute the average, by state, of the responses on untouchability practice by non - SC / ST households. Untouchability victim is equal to 1 if an SC household answers yes to the question “have some household members experienced untouchability?” I then compute the average, by state, of the responses on untouchability practice by non - SC / ST households.
- The states included are the 17 large states of India in the year 1992. These states are: Andhra Pradesh, Assam, Bihar, Gujarat, Haryana, Himachal Pradesh, Jammu and Kashmir, Karnataka, Kerala, Madhya Pradesh, Maharashtra, Odisha, Punjab, Rajasthan, Tamil Nadu, Uttar Pradesh, and West Bengal. Like Iyer et al. (2012), I use the 1992 definition of the frontiers of states throughout the analysis of state data, to maintain comparable units over time. Hence for all empirical analysis and visual representations (the map used for visual representation shows the 2019 political boarders of India), I attribute crimes committed within the three new states created in 2001 or after to the states that they initially belong to. I combine the data of Andhra Pradesh and Telangana, of Chhattisgarh and Madhya Pradesh, of Jammu & Kashmir and Ladakh, of Jharkhand and Bihar, and of Uttarakhand and Uttar Pradesh. The states in the sample account for over 90% of the crimes committed in each of the crime categories.
- This approach allows to account for the small number of observations. The standard Pearson correlation matrix gives similar conclusions (displayed in Girard 2020).
Further Reading
- Aneja, A and SK Ritadhi (2020), ‘How Representation Reduces Minority-targeted Crime: Evidence from Scheduled Castes in India’, mimeo.
- Bros, Catherine and Mathieu Couttenier (2015), “Untouchability, Homicides and Water Access”, Journal of Comparative Economics, 43(3):549-558.
- Desai, S, R Vanneman and National Council of Applied Economic Research (2015), ‘India Human Development Survey-II (IHDS-II), 2011-12’, Inter-university Consortium for Political and Social Research, ICPSR36151-v2, Michigan, Ann Arbor, 31 July 2015.
- Deswal, Vageshwari (2013), “Burking of crimes by refusal to register fir in cognizable offences”, Journal of the Indian Law Institute, 55(3):361-375.
- Girard, V (2020), ‘Stabbed in the back? Mandated political representation and murders’, Novafrica Working Paper.
- Iyer, Lakshmi, Anandi Mani, Prachi Mishra and Petia Topalova (2012), “The Power of Political Voice: Women’s Political Representation and Crime in India”, American Economic Journal: Applied Economics, 4(4):165-193.
- Kumar, TK Vinod (2015), “Impact of Demographic Characteristics of Crime Victim on Interaction with Police in India - Gender, Caste, Class and Police Response”, South Asian Survey, 22(1):54-77.
- Minj, Jayant (2018), “Offences against Schedule Castes and Schedule Tribes”, Journal Of Human Rights Law And Practice, 1(1):12-17.
- Sharma, Smriti (2015), “Caste-based Crimes and Economic Status: Evidence from India”, Journal of Comparative Economics, 43(1):204-226.

By: Sreenivasan Subramanian 23 September, 2020
Both instructive and sad.