

 15 September, 2025


While India’s economy experienced steady growth over the last 20 years or so, the growth in employment has not kept pace and key challenges remain to the creation of good-quality jobs. In this post, Gulati, Mahajan and Sharma outline six insights pertaining to the jobs landscape in the country today – unbalanced employment generation across sectors, stagnant real wages and low worker productivity, high unemployment rates among educated youth, lack of social protection, limited female labour force participation, and disparities across regions.
Over the past two decades, India’s economy has expanded steadily, with per capita income growing at about 5% per year. But behind this headline growth lies a more sobering story about jobs. The pace of employment growth has lagged far behind, at just 1.6% per year. Official estimates suggest that catering to the expanding workforce would require 8 million non-farm jobs to be created annually, on average, until 2030.
Despite recent improvements in workforce participation — an increase of 10.5 percentage points (p.p.) since 2017 — there are several challenges to the creation of good-quality jobs. In this post, we lay out six key insights about jobs and employment trends in India today (Gulati, Mahajan and Sharma 2025).
Job creation has not been balanced across sectors
Workforce participation has been rising in recent years, though at varying rates in different sectors (Figure 1). These trends over the last few decades reveal particular features of the structural transformation process of the Indian economy.
Figure 1. Workforce participation by sector
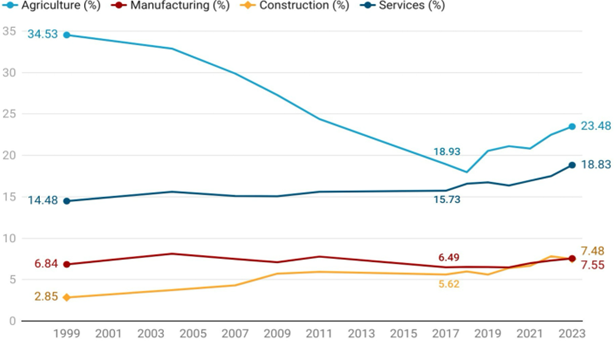
Notes: (i) Agriculture includes farm cultivation, forestry, fisheries, and animal husbandry. Manufacturing includes national industry classification codes for manufacturing, mining, waste, and energy. Construction includes mining, electricity, gas, and water. (ii) Share of each sector is calculated over the total population in that year.
Source: Employment and Unemployment Surveys – National Sample Survey (EUS-NSS) until 2017-18 and Periodic Labour Force Survey (PLFS) thereafter (weekly status, ages 15-59). The data source for other figures is the same, unless mentioned otherwise.
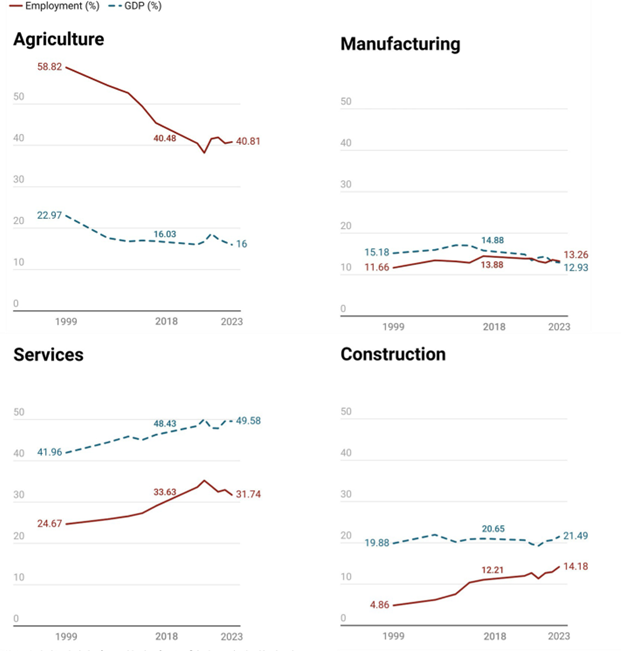
Starting in the late 1980s, as India underwent structural transformation, the share of agriculture in gross domestic product (GDP) dropped from 36% in 1980-81 to 16% in 2023-24. Over the same period, the share of services rose from 38% to 50%. For manufacturing, the GDP contribution has remained in the range of 13-17% (with some decline since 2010) while construction’s share has remained stable between 18% and 21%. Hence, economic growth has largely been services-led. However, in terms of sectoral shares of employment, in 2023-24, agriculture continues to employ about 40% of the workforce. The second largest share of the workforce is in services (32%), with manufacturing and construction engaging 13% and 14%, respectively (Figure 2). Hence, while services did create jobs, their scale has not been on par with the sector’s contribution to GDP.
Figure 2. Sectoral contribution to growth and employment
International comparisons show that the non-agricultural workforce in India continues to be smaller than in countries with similar GDP per capita (Figure 3). The stagnation of manufacturing,1 and growth in only a narrow set of services, has resulted in a sluggish pace of non-agricultural job creation and curtailed labour productivity gains since agricultural jobs are less productive than non-agricultural jobs. To sum up, while participation has improved, sectoral contributions remain uneven.
Figure 3. Non-agricultural workforce and GDP per capita, India versus other countries (2022)
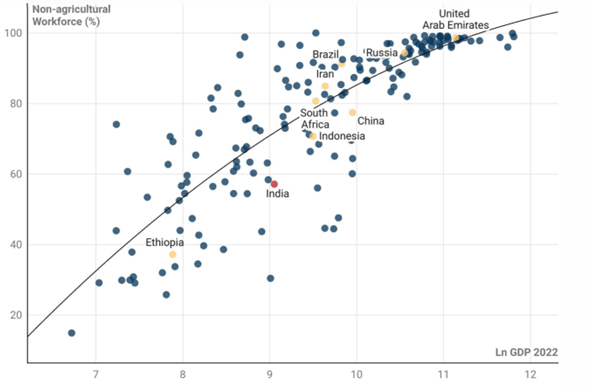
Note: GDP per capita data (2022) are in US dollars, 2021 constant prices (adjusted for purchasing power parity).
Source: World Bank.
Real wages are stagnating and growth in labour productivity is slow
In recent years, GDP growth has not translated into growth in real wages. Between 2021-22 and 2022-23, real GDP grew at 7% while real wages declined by almost 3%, on average.2 As seen in Figure 4 below, wages vary significantly across categories of jobs: average earnings for salaried workers are double those of casual workers, and workers in the formal sector are paid twice as much as those in the informal sector.
Figure 4. Real daily wages (Rs.), by worker and enterprise type
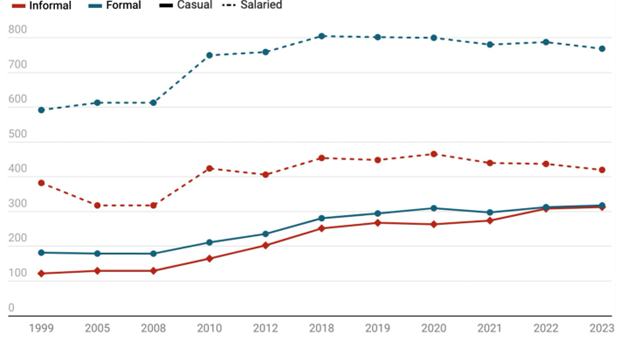
Notes: (i) The base year is 2017. (ii) For conversion of nominal wages into real wages, Consumer Price Index (CPI) UNME (urban non-manual employees) has been used for urban data and CPI RL (rural labourers) for rural data. (iii) Since CPI UNME is not available for 2023-24, the latest year in this table is 2022-23. (iv) Formal sector includes enterprises with greater than 10 employees.
However, the growth in wages has been lower within high-wage, high-productivity jobs. During 2017-2023, the real wages of salaried workers declined overall (-1.6%), across both the formal (-4.5%) and informal sectors (-7.5%).3 This stands in sharp contrast with casual workers, who experienced an increase of 23.2% in their real daily wages over the six-year period. The casual workers who benefit the most are those engaged in the informal sector, where real wages of casual workers rose by 24.4%, rather than those in the formal sector, where real wages rose by 13.1%. This could indicate that the relative demand for casual workers is greater than for salaried workers. Thus, while GDP has grown, labour productivity and wage growth have not kept pace.
The stagnation of wages in the formal sector shows that there are key constraints to creating high-productivity jobs in the economy. This has important implications for average labour productivity in India, which, at US$10.7 per hour of labour input, is among the lowest in the world. 98% of Indian firms have fewer than 10 employees; yet, they employ 75% of the non-agricultural workforce, indicating that the majority of our non-agricultural workforce is stuck in relatively less productive jobs. Easing constraints to formal-sector growth, by promoting private investment, enhancing ease of doing business, and improving infrastructure, is critical to transition the workforce from low-productivity to high-productivity jobs.
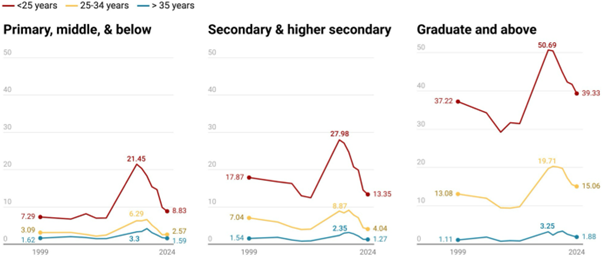
India’s educated youth lack the skills for gainful employment
The Economic Survey of India, 2024-25, notes that one in two college graduates do not possess high competency or specialised skills, and hence, are employed in roles below the level of their educational qualifications. Besides underemployment, the mismatch between qualification-based aspirations and skill-based job market realities manifests in open unemployment among highly educated youth. Two-fifths of 15-24-year-olds with at least a graduate degree are out of work (Figure 5), even as overall unemployment rates have reduced by 5-10 p.p. over the last six years. Within the age categories of under-25 and 25-34 years, unemployment is 26 p.p. and 11 p.p. higher (an almost three-fold to four-fold gap), respectively, among people with graduate degrees when compared to those with only a secondary/higher secondary level of education.
Figure 5. Unemployment rates (%), by age group and education level, 2023-24
There is a pressing need to expand the availability of high-quality, industry-aligned skilling programmes and apprenticeships. Moreover, the effectiveness of any skilling programme is contingent upon foundational literacy and numeracy skills, which are acquired during school. Therefore, improving the quality of elementary education is crucial to tackle India’s skills problem.
Besides, there are inefficiencies in matching the supply of skills in the labour market with the demand for those skills. Reliance on social networks for jobs may not be sufficient, as competition discourages information-sharing and reduces match quality (Chiplunkar, Kelley and Lane 2024). Job portals could help scale up matching. However, bringing jobseekers and employers together may not be enough if there are differences in the aspirations of the jobseekers and the jobs available in the economy. Jobseekers may be less willing to take up or continue a job if it does not match their expectations (Chakravorty et al. 2021).
The vast majority of the workforce lacks social protection
Greater contribution of the non-agriculture sector towards income and employment typically characterises the structural transformation process; however, this is truly a success when accompanied by formalisation of employment. This is because formal jobs are typically more productive than informal jobs.
Between 1999-2000 and 2018-19, the share of non-agricultural employment increased by 21 p.p., but the share of salaried workers (proxy for formal work) increased by only 11 p.p. The share of the workforce employed in formal jobs is also substantially lower in India than in other countries with a similar level of per capita GDP (Figure 6). More recently, from FY 2019-20 to FY 2022-23, the percentage of the workforce engaged in salaried work declined from 30.3% to 27.7%.
Figure 6. Formal workforce and GDP per capita (PPP adjusted), 2023
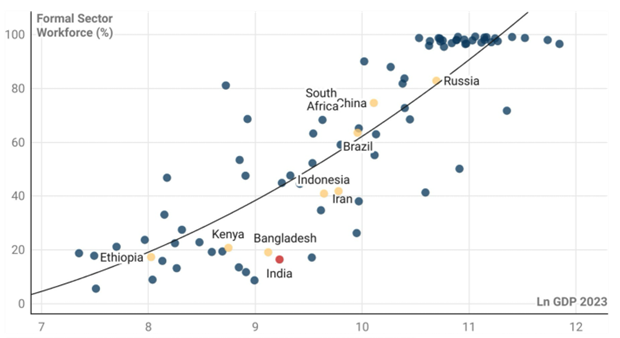
Source: Informal data are sourced from multiple national and international datasets. (i) Global estimates are based on the ILOSTAT Database, using the current ILO definition of informal employment. (ii) For India, data are drawn from respective NSS and PLFS datasets. (iii) China’s figures are taken from Park et al. (2013). (iv) Data for South Africa and Ethiopia come from the World Bank’s Human Capital Data Portal. (v) Indonesia’s information is obtained from BPS-Statistics Indonesia. (vi) For Iran, data are sourced from Kelishomi and Nistico (2024).
Another marker of formal jobs is the availability of social protection. Even among the urban, non-agricultural workforce (which constitutes 26.4% of the total workforce), only 37.2% had written contracts in 2023-24, 32% had health benefits, and 42% had social security.4 Hence, a majority of the country’s workforce operates under precarious conditions, characterised by low earnings and a lack of social protection.
Figure 7. Proportion of workforce with written contracts, health benefits, and social security

The emergence of the gig economy can further increase informality in the workforce. These platforms have created new opportunities to work flexibly and outside traditional employment structures, which can be invaluable for workers such as women with care responsibilities. However, gig workers are also more vulnerable to the lack of social protection. The Code on Social Security, 2020 – an endeavour to extend social security to all workers including gig and platform workers – is a notable step in this regard.
Female labour force participation, while increasing, remains low
In 2023-24, the labour force participation rate among urban women stood at 29.3% and among rural women at 42.8%, as against 82.8% and 81.4% respectively for men. This national average female labour force participation (FLFP) rate of 34% reflects an increase compared to previous years. However, India remains well behind other lower middle income countries such as Bangladesh (37%), the Philippines (47.2%), and Vietnam (68.5%) (Figure 8).
Figure 8. Female labour force participation and GDP per capita, across countries
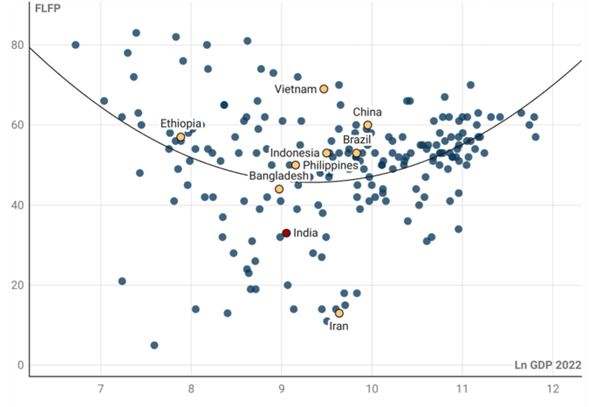
Notes: GDP per capita (2022) data are in US dollars, 2021 constant prices (adjusted for purchasing power parity).
Source: World Bank.
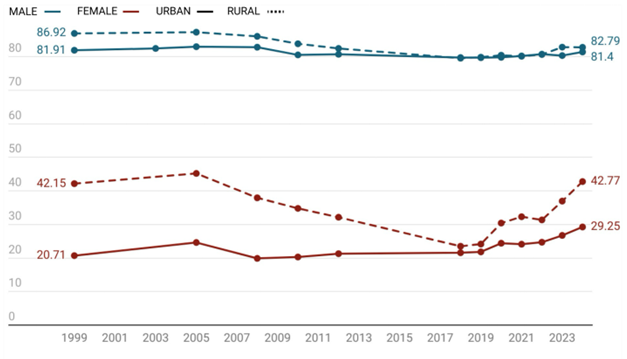
Taking a longer-term view, India’s FLFP declined between 2004-05 and 2017-18, while the past five years or so have witnessed a reversal of this trend. Rural women have always participated in the labour market at higher rates than urban women, and it is this group that has increased labour force participation since 2018. However, the increase is partly driven by unpaid, low-productivity work (Deshpande 2025).
Figure 9. India’s labour force participation rates, by gender and region
A large body of research has explored the constraints on FLFP on both the supply and demand sides. The most prominent factor is social norms (Jayachandran 2021), which manifest in different ways across the home, public spaces and the workplace, creating conditions that are unfavourable for women’s work. Within households, pro-male bias limits investment in the human capital development of girls and makes them less likely to own assets. This is exacerbated by the penalty imposed by the marriage market on working women (Afridi et al. 2025). Further, women disproportionately bear the burden of domestic and care responsibilities (Sarkhel and Mukherjee 2020), leaving them with less time to engage in paid work. Outside the home, women face restrictions on mobility and threats to safety. Districts with higher rates of sexual violence have lower rates of FLFP (Chakraborty and Lohawala 2021). Finally, many women may acquire skills that are ill-matched to market demand.
On the demand side, in the workplace, women are often discriminated against in the type of work assigned to them and opportunities for career progression, leading to a gender gap in earnings (Kunduri, Gupta and Kumar 2019). Even when women enrol in public training and job placement programmes such as Deen Dayal Upadhyaya Grameen Kaushalya Yojana (DDU-GKY), they are less likely than men to receive job offers and less likely to take up any offers received (Moore and Prillaman 2019). While the former is indicative of discrimination, the latter is attributed to the lack of support from family members and concerns about safety in urban areas. More broadly, a lack of quality job opportunities has hamstrung the increase of women in the non-agricultural sector. While countries like Bangladesh and Vietnam witnessed a growth in export-driven textile sectors (Rahman and Islam 2013), accompanied by a rise in FLFP, India failed to do so. In general, the small size of Indian firms makes employment conditions unfavourable for the entry of women (Chakraborty and Mahajan 2025). Finally, women own only 13% of enterprises in the country; increasing female entrepreneurship rates can provide an impetus to FLFP as a whole because women are known to hire more women (Chiplunkar and Goldberg 2024).
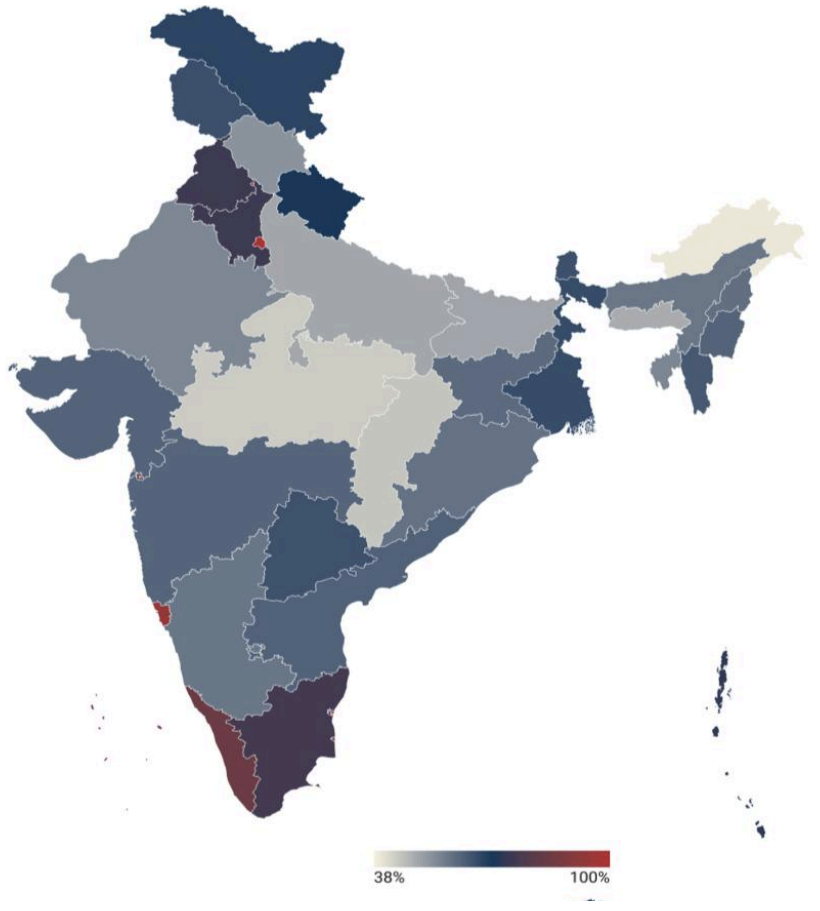
Regional disparities exist in employment
There is significant variation across Indian states in the rates of structural transformation. While states like Goa and Kerala have relatively high proportions of their workforce in non-agricultural sectors, at 94% and 84% respectively, the figures are 44% for Madhya Pradesh and about 50% for Bihar and Uttar Pradesh. In terms of regional averages, the West is in the lead (72%), followed by the South (68%) and the North (63%), with the Eastern (58%), Northeastern (56%) and Central (44%) states lagging behind.
Figure 10. Share of non-agricultural workforce across states
When growth is concentrated in certain pockets of the country, migration can serve as a vital safety valve and development catalyst by moving labour from low-productivity regions to high-productivity regions. It can also spur the local economy through an increased flow of remittances, while also providing skills to migrant workers. Thus, well-designed policies that decrease frictions in migration, protect migrant rights, and channel remittances into productive investments can maximise these benefits and help rebalance regional development over time. Internal migration can also address imbalances in demographic transition between North and South India, where the population of the South is ageing at a faster rate.
However, addressing regional disparities requires more than just enabling migration. While migration to high-growth urban centres can offer opportunities, it also brings challenges such as congestion and environmental degradation. Thus, there is a need for creation of region-specific policies to promote job creation in less-developed regions.
Looking ahead: Key policy questions
Addressing the future of jobs in India will require simultaneous progress on three fronts: participation, productivity, and protection, ensuring more people can work, in more productive jobs, with better social safeguards, and with opportunities spread more evenly across regions.
To navigate these challenges, there is a need for debate on the most impactful solutions to unlock job-rich growth, improve job quality, enhance job-readiness of workers, and expand access to opportunity across regions. We note below some key questions around policy choices to foster growth of productive employment in the country:
- To meet the need for 8 million new non-farm jobs annually, which sectors should industrial policy prioritise, and what kind of support – broad-based reforms or targeted incentives – works best? Can trade policy be reshaped to support domestic job creation?
- What reforms to land, labour and regulatory frameworks can spur formal sector expansion, and how can micro, small and medium enterprises be supported to scale up and create productive jobs?
- How can skilling keep pace with industry needs and technology shifts like Artificial Intelligence, and what role should the government and industry play?
- How can we extend protection to gig and informal workers without reducing flexibility? What can India learn from international models?
- What practical interventions — from childcare to workplace safety — can boost female labour force participation? How can firms be incentivised to offer quality jobs that do not impose added costs?
- Should policy support place-based development, enable migration, or both? How can state-level governance reforms attract more private investment in underdeveloped regions?
The views expressed in this post are solely those of the authors and do not necessarily reflect those of the I4I Editorial Board.
Notes
- Despite being a labour-abundant country, restrictive labour regulations increase the effective cost of labour, and several industries in India are capital intensive.
- The analysis excludes the self-employed.
- The overall growth in salaried wages is higher than for the formal-salaried and the informal-salaried because of an increase in the proportion of formal-salaried workers in the workforce from 14.2% in 2017 to 16.4% in 2023.
- For social security, the workforce is classified as per Principle Working Status. Non-agricultural workforce excludes agriculture and animal husbandry.
Further Reading
- Afridi, F, A Arora, D Dhar and K Mahajan (2024), ‘Women’s Work, Social Norms and the Marriage Market.’, Discussion Paper No. 15948, Institute of Labor Economics (IZA).
- Chakraborty, P and K Mahajan (2023), ‘Scaling up to Decrease the Divide: Firm Size and Female Employment’, Economics Discussion Paper No. 103, Ashoka University.
- Chakraborty, T and N Lohawala (2021), ‘Women, Violence and Work: Threat of Sexual Violence and Women’s Decision to Work’, IZA Discussion Paper No. 14372, Institute of Labor Economics (IZA).
- Chakravorty, Bhaskar, Wiji Arulampalam, Apurav Yash Bhatiya Clément Imbert and Roland Rathelot (2024), “Can information about jobs improve the effectiveness of vocational training? Experimental evidence from India.”, Journal of Development Economics, Vol. 169, 103273, June. Available here.
- Chiplunkar, Gaurav and Pinalope Koujianou (2024), “Aggregate Implications of Barriers to Female Entrepreneurship.” Econometrica, Vol. 92(6), 1801–1835, November. Available here.
- Deshpande, A (2025), ‘Too good to be true? Steadily rising female labour force participation rates in India’, Centre for Economic Data & Analysis (CEDA), Ashoka University.
- Gulati, N, K Mahajan and A Sharma (2025), ‘India at Work: Challenges and the Road Ahead’, Policy Discussion Paper, Isaac Centre for Public Policy, Ashoka University, 17 July.
- International Labour Organization (2024), ‘Statistics on labour productivity’, ILOSTAT.
- Kunduri, E, R Gupta and S Kumar (2019), ‘Industrial spaces and women’s work: Reflections from Delhi’, Initiative for What Works to Advance Women and Girls in the Economy (IWWAGE), August.
- Ministry of Finance (2013), Economic Survey 2012-13, Government of India.
- Ministry of Finance (2024), Economic Survey 2023-24, Government of India.
- Ministry of Rural Development, Deen Dayal Upadhyaya Grameen Kaushalya Yojana (DDU-GKY), DDU-GKY official portal, Government of India.
- Ministry of Statistics and Programme Implementation (2016), All India Report of Sixth Economic Census, National Statistical Office, Government of India.
- Moore, CT and S Prillaman (2019), ‘Making Skill India Work for Women’, Institute for What Works to Advance Gender Equality (IWWAGE).
- National Statistical Office, Ministry of Statistics and Programme Implementation (2021), Periodic Labour Force Survey (PLFS): Annual Report, July 2019-June 2020, Government of India.
- Rahman, RI and R Islam (2013), ‘Female labour force participation in Bangladesh: Trends, drivers and barriers’, Asia-Pacific Working Paper Series, International Labour Organization.
- Sarkhel, S and A Mukherjee (2020), ‘Motherhood and labor market penalty: a study on Indian labor market’, Discussion Paper No. 673, Global Labor Organization (GLO).
- World Bank (2025), GDP per capita growth (annual %) – India, World Development Indicators.
- World Bank (2025), ‘Labor force participation rate, total (% of total population ages 15–64) (modeled ILO estimate)’, World Bank Gender Data Portal.

Comments will be held for moderation. Your contact information will not be made public.