

 21 October, 2015


Credit Suisse recently reported that the richest 10% Indians own about 75% of the country's wealth, highlighting the growing problem of inequality. This column presents trends in inequality in India during 1961-62 – 2002-03 based on relative, absolute and intermediate measures. It demonstrates that growth may be considered inclusive or exclusive depending on the measure of inequality used.
We live in a society marked by deep economic inequality, a fact that is only underlined and magnified by the presence of massive levels of poverty at one end of the spectrum, and massive levels of unaccounted income and wealth at the other. In this article, we present a microscopic primer on inequality in the distribution of household assets in India.
Growth in household wealth
Data on the distribution of household wealth in India are available over 10-year intervals at least from 1961-62, in the surveys on debt and investment conducted by the Reserve Bank of India (RBI) and the National Sample Survey Office (NSSO). Table 1 shows a systematic rise in the average real value of assets held by households. The growth in the value of assets per household is considerably sharper in urban areas as compared to rural areas. From 1981-82 to 2002-03, the average real value of household assets rose by a factor of less than two in rural India, and by more than 2.5 times in urban India. Urban India, after all, is the home of industrial and financial capital, and the growth in the wealth of identifiable corporate houses has been
Table 1. Growth in household asset holdings, Rural and urban India (1961-62 — 2002-03)
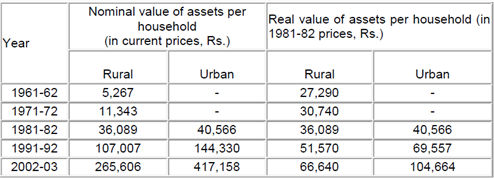
Note: All real values are in 1981-82 prices using the Wholesale Price Index (WPI) as
Source: Subramanian
Combining Business Standard data on the ultra-wealthy with the official survey data for 2002-03, we find that at the all-India level, the wealthiest 178 households accounted for 0.00009% of all households, and for 2.05% of the country's estimated wealth. This means that the ratio of the Business Standard's ultra-wealthy entities' share in the value of assets to their share in population was a staggering 23,239! Such acute concentration of wealth is a reflection of prosperity in a small island amidst a vast ocean of generalised deprivation. Unfortunately, the presence of such prosperity - especially in urban India – has often been taken to indicate the relative absence of poverty. The truth is that high levels of prosperity for a minuscule section of the urban population comfortably co-exist with high levels of poverty for vast numbers of people at the lower end of the wealth distribution profile. This is most apparent in the fact that real estate is the most important component of household assets in urban India: the visual contrast afforded by the shanties and huts and slums of urban India on the one hand, and its residential palaces and shopping malls and skyscrapers on the other, is a bleak and direct pointer to the levels of inequality we so easily accommodate in our lives.
It seems reasonable to believe that the largest absolute increases in wealth would have accrued to the wealthier households, though this may well be compatible with roughly equal proportionate increases across all wealth classes. Consider a two-household world in which the wealthier household has an asset base of Rs. 100, and the poorer household an asset base of Rs. 10. If now the wealthier household's asset base increases to Rs. 150, and that of the poorer household to Rs. 15, then both households will have experienced an identical 50% increase in their respective asset levels, although the richer household would have gained an additional Rs. 50 in comparison with the very small gain of Rs. 5 for the poorer household. Growth will be judged to have been 'equalising' if we focus only on rates of growth, and dis-equalising if we focus only on absolute amounts of growth. Our judgment on trends in inequality would
Alternative measures of inequality: relative, absolute, and intermediate
A relative measure of inequality (which is the sort of measure that is overwhelmingly favoured in the bulk of the inequality measurement literature) is one whose value remains unaltered when we have an equal proportionate increase in all wealth levels. An absolute measure of inequality is one whose value remains unaltered when we have an equal absolute increase in all wealth levels. Here is an example, first, of a relative inequality measure (call it R), and then of an absolute inequality measure (call it A), for a two-person world. Suppose R is given by the difference in the wealth levels of the two individuals expressed as a proportion of the total wealth, and A simply by the difference in the wealth levels of the two persons. Consider the two-person distribution x = (10,20), which means that the poorer person has a wealth level of 10 and the richer person a wealth level of 20. Consider also the distributions y= (20,40) and z = (20,30). It is easy to see that y has been derived from x through an equal proportionate increase in both persons' wealth levels (both wealth holdings have been doubled) while z has been derived from x through an equal absolute increase in both persons' wealth levels (both wealth holdings have been increased by Rs. 10).
The value of the inequality measure R for the distribution x is (20-10)/30 = 0.33, while for the distribution y, R is (40-20)/60 = 0.33. The relative character of the measure R is reflected in the fact that its value (at 0.33) has remained unaltered by an equal proportionate increase of all incomes in the change from x
The French economist Serge-Christophe Kolm (1976) referred to relative measures as 'rightist' and absolute measures as 'leftist', in the presence of income or wealth growth. This is because relative measures do not register any increase in value when there is an equal proportionate increase in all wealth levels, even though this means a larger absolute increase the richer the wealth-holder is2. Absolute measures do not register any decline in value with an equal absolute increase in all wealth levels, even though this means a smaller rate of growth the richer the wealth-holder is. One may regard the values underlying relative and absolute measures of inequality to be somewhat extreme, postulated, as they are, on either end of the ideological spectrum. A more moderate approach to inequality conceptualisation is an intermediate one, in terms of which inequality is regarded as increasing with an equal proportionate increase in all wealth
A well-known relative index of inequality is the (relative) Gini coefficient. This measure is related to the 'Lorenz curve', which is derived by plotting the cumulative income share of a population against its cumulative population
An example of an absolute index of inequality is the (absolute) Gini coefficient (advanced by Moyes (1987), and given simply by the product of the average level of wealth and the relative Gini coefficient). It is not important for us to know precisely how the relative and absolute Gini measures are actually derived or computed, or what the formulae for them are. It suffices to know that one is a relative – and therefore 'rightist' –
It turns out that one can derive an intermediate Gini coefficient by simply multiplying the relative and absolute Ginis: the resultant index will display the property of registering a rise in inequality when there is an equal proportionate increase in all wealth levels and a decline in inequality when there is an equal absolute increase in all wealth levels. (This is the defining property of an intermediate inequality measure.) An intermediate inequality measure such as the intermediate Gini steers clear of the 'extreme' values of right and left on which relative and absolute inequality measures are, respectively, predicated. There is, therefore, a strong case in favour of pursuing this moderate 'middle path' in our empirical assessment of inequality in the distributions of consumption expenditure and wealth.
Trends in inequality
Table 2 presents alternative absolute, relative and intermediate Gini measures of inequality for rural and urban India during 1961-61 and 2002-03. It is easily discernible that while there are high levels of inequality in the distribution of assets across households, the relative measures display no increase over time – and, indeed, a definite decline in the urban areas over the three decades from 1981-82 to 2002-03. This picture is very sharply inverted by the trends in the absolute measures.
Table 2. Inequality in the distribution of household assets: Three versions of the Gini coefficient, Rural and Urban India, (1961–62—2002–03)
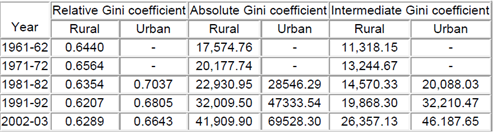
Note: The absolute and intermediate Gini coefficients are presented in 1981-82 prices.
Source: Subramanian and Jayaraj (2008, 2013a, 2013b); Computations based on data from RBI/NSSO surveys on debt and investment.
A more moderate view, surely, is afforded by an intermediate conceptualisation of inequality. Table 2 clearly indicates that even such a 'centrist' view of inequality yields a picture of
Some conclusions
In the following points, we summarise the somewhat obvious conclusions which this article yields:
1. Purely relative measures of inequality do not suggest any increase in inequality in the distribution of household assets in India.
2. Absolute measures of inequality sharply reverse the trend displayed by relative measures.
3. Arguably, intermediate measures of inequality reflect more reasonable, and moderate, values than either 'rightist' relative measures or 'leftist' absolute measures. As it happens, the 'centrist' intermediate Gini also reflects a clearly increasing trend of inequality in the distribution of assets across households.
4. Both magnitudes and trends of inequality, as reflected by distributional data in official sample surveys, are likely to be understated for various reasons, including underestimation of wealth in the upper end of the distribution, and a burgeoning unaccounted economy characterised by under-reporting – again at the upper end of the distribution - of the extent and value of ownership of land and gold, illegal foreign exchange transactions, and false invoicing of imports and exports.
5. In view of these observations, it is fair to suggest that India is a country with a very large and increasing level of inequality in the distribution of household wealth.
6. It is important to note that the inequality we speak of relates to an economy with enormous income and non-income deprivation: inequality in such circumstances would be seriously viewed even by a relatively 'conservative' distributional ethic such as '
7. The growth in average levels of wealth and income in India has been greeted by its elite with a great deal of enthusiasm and fanfare (though even the income-growth story is now beginning to unravel). It is a particularly harsh symptom of both ignorance and insensitivity that the presence of large and increasing amounts of prosperity restricted to small sections of the population has been misinterpreted as signifying small and diminishing levels of poverty for large sections of the population. The presence of prosperity is not the same thing as the absence of poverty. Both can co-exist, and do so, quite blatantly, in our country - and certainly more so in urban than in rural India.
8. would imagine that such a situation should attract some serious measure of land reform, enhanced direct taxation (especially of corporate and agricultural income, and on wealth and bequests), and a minimally principled effort to contain a burgeoning unaccounted economy. What we have, instead, is a failed programme of land reform (now a matter of the distant past); an under-taxed economy in which budgetary deficits are sought to be addressed by reducing already low levels of spending on the social sector and capital creation, not to mention promises of a complete abolition of income tax for all but the wealthiest; and a remarkably permissive environment of political, bureaucratic and corporate fraud, and non-compliance.
9. Apart from the intrinsic moral and political unsustainability of large levels of inequality in wealth holdings and incomes, there are instrumental reasons to set one's face against such trends of increasing concentration. These have to do with the deleterious effects of inequality on, among other things, efficiency, social cohesion, aggregate demand, and public health outcomes. These are matters which will not even come up for public discussion and debate if we continue to employ protocols of measurement that are heavily biased in favour of 'conservative' relative measures of inequality.
10. Finally, it cannot have escaped the reader's attention that this article does not enlighten those who already know its drift, which is almost everybody; but it might have the effect of an annoying reminder on those who refuse to acknowledge it, which is no trivial constituency.
This essay is based on earlier work done by the
A version of this article appeared in May 2014 on the Infochange website, which is an online repository of information and analysis on social justice and sustainable development in India, initiated by the Centre for Communication and Development Studies (CCDS) in Pune. The authors are grateful to Ms Hutokshi Doctor of CCDS for permission to have their piece reprinted here.
Notes:
- This is reflected in Business Standard's list of the wealthiest households/entities.
- This 'rightist/leftist' characterisation, of course, holds only in case of growth – and not regression – of wealth. In the remaining analysis, we assume that it is growth – and not decline - in average wealth that is of interest.
Further Reading
- Frankfurt, Harry (1987), "Equality as a Moral Ideal", Ethics, 28(1), 21-43.
- Kolm, Serge-Christophe (1976a), "Unequal Inequalities I", Journal of Economic Theory, 12(3), 416-454.
- Kolm, Serge-Christophe (1976b), "Unequal Inequalities II", Journal of Economic Theory, 13(1), 82-111.
- Krtscha, M (1994), "A New Compromise Measure of Inequality', in Eichhorn, W (ed.), Models and Measurement of Welfare and Inequality, Heidelberg: Springer-Verlag.
- Moyes, Patrick (1987), "A New Concept of Lorenz Domination", Economics Letters, 23(2), 203-207.
- Subramanian, S and D Jayaraj (2008), 'The Distribution of Household Wealth in India', in Davies, JB (ed.), Personal Wealth from a Global Perspective, Oxford: Oxford University Press.
- Subramanian, Sreenivasan and Dhairiyarayar Jayaraj (2013a), "Economic Inequality in India: Value-Neutral Measurement?", Challenge: The Magazine of Economic Affairs, 56(4), 26-37, July-August.
- Subramanian, Sreenivasan and Dhairiyarayar Jayaraj (2013b), "The Evolution of Consumption and Wealth Inequality in India: A Quantitative Assessment", Journal of Globalization and Development, 4(2): 253-281.

Comments will be held for moderation. Your contact information will not be made public.