

 01 April, 2019


Research shows that entrepreneurship or new firm formation can be an important driver of economic development. This article studies the extent of new firm formation in India over the last 40 years and documents patterns that emerge. It shows that new firm formation has steadily grown over the last 40 years implying shifting concentration of economic activity from a limited number of firms to a large number of new entrants.
There is a considerable body of research that shows that entrepreneurship or new firm formation can be an important driver of economic development. Entry of new businesses fosters dynamism, competition and growth in a modern market economy (Klapper, Laeven and Rajan 2007, Klapper et al. 2010). In this article we study the extent of new firm formation in India over the last 40 years and document the patterns that emerge from our analysis.
In absence of any universally accepted definition of entrepreneurship, following some of the studies in the literature we define firm formation as the setting up by an individual or a group of a unit in the formal sector that is aimed at undertaking economic activities and is incorporated as a legal entity. Specifically, we look at the number of new firms registered every year under: (a) the Companies Act, 2013 or Companies Act, 1956; and (b) the Limited Liability Partnership (LLP) Act, 2008 over the last four decades. We also include foreign companies and LLPs, where the established place of business is India. We include newly registered firms in our sample irrespective of the current status of the entities (that is, active, inactive, struck-off, etc.). The objective is to document the total number of new firms formed every year.
We obtain our data from the Ministry of Corporate Affairs (MCA) website. Whenever a new firm is formed in the formal sector, it is legally required to register with the MCA. Upon registration it obtains an identification number called Corporate Identity Number (CIN). We look at the number of unique CIN codes, firm names, and the dates of registration. We do not have access to any other information about these new firms which prevents us from undertaking additional analysis about their characteristics. We also do not have data on the stock of firms every year which implies that we are not able to look at the share of new firms formed every year. We can only document and comment upon the absolute number of new firms annually registered with the MCA.
Evolution of firm formation
In figure 1 we plot the total number of new firms registered with the MCA every year during the period 1980-2018. We have data for all the years except 2015.
Figure 1. New firms registered with MCA every year
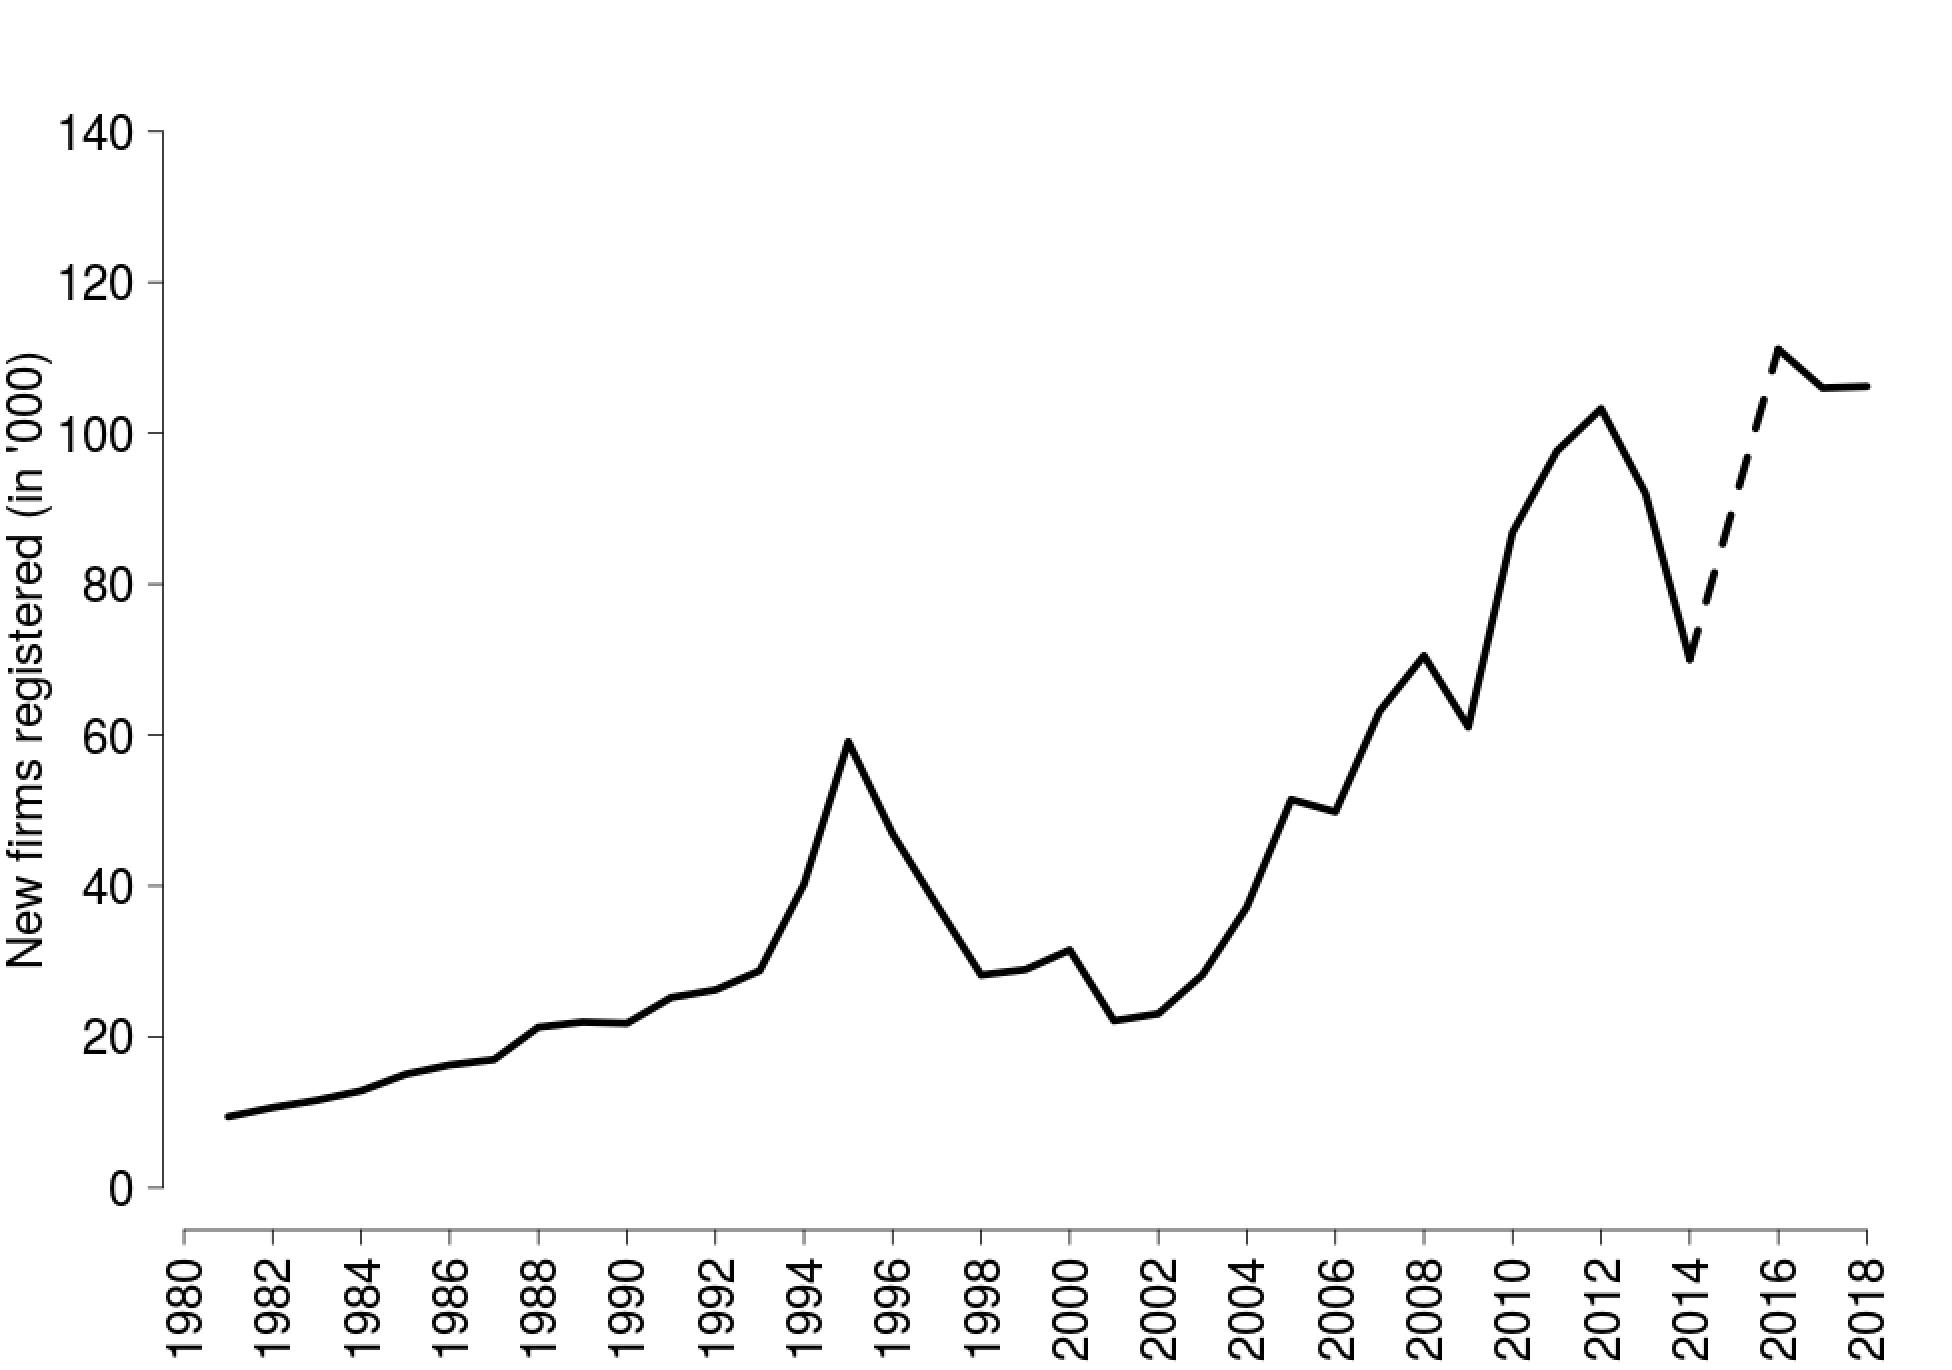
We find that on an average, 45,600 new firms got registered every year in India during the four decades for which we have data. The average annual growth rate of firm formation in the formal sector is 7.5% for the entire period. For the first 15 years in the run up to the liberalisation reforms of the early 1990s, there was a steady growth in firm formation in a low volatility environment.
In the first few years of liberalisation namely 1994 and 1995, we find a tremendous increase in firm registration. The year-on-year growth rates of new firm registrations in 1994 and 1995 were 40% and 47% respectively. This was more than twice the average firm formation of the previous years. Between 1996 and 1998, the rate of firm formation dropped sharply to about 22%, bringing us back to the levels of the early 1990s. Since then, new firm formation has steadily picked up. The exception was 2001, the year of the dot-com bubble burst, when the rate of firm registration dropped to 29.8%. This is the highest yearly drop observed in our study period.
Between 2003 and 2005, the annual growth in firm formation was consistently high (22.43%, 31.78% and 38.26% respectively). This more than doubled the new firms registered every year. Although registrations dipped slightly in 2006 (-3.16%), the momentum continued in 2007-08. According to the existing business cycle literature (Pandey, Patnaik and Shah 2017), India experienced an economic boom during the period 2003-2007. The MCA data shows that during this expansionary phase, firm formation grew at an average annual rate of 23%.
Firm registrations witnessed a sharp drop (13.4%) in 2009 followed by an even sharper recovery in 2010 (42.2%). The modest increase in 2011-12 was followed by consecutive declines in 2013 and 2014 (10.9% and 23.9% respectively).
In 2012, for the first time, we observe more than 100,000 new firms getting registered. Data for 2015 is missing but the level of firm formation in 2016-18 remained at par with that observed in 2012.
Extremely high new firms registrations (greater than 25%) were observed in the years 1988, 1994-95, 2004-05, 2007, and 2010. New firm registrations dropped in 1990, 1996-98, 2001, 2006, 2009, 2013-14, and 2017. The highest drop was observed in 2001 (-29.77%) closely followed by 1998 (-24.7%) and 2014 (-23.9%).
Growth phases in firm formation
To find out if there were different growth phases in firm formation, we look for structural breaks to identify time points at which the regime may have shifted. Following the Perron-Bai algorithm as implemented by Patnaik, Shah and Zeileis (2003), we estimate the breakpoints in our dataset. Our estimation yields four separate regimes as shown in Figure 2. The figure shows the average number of firms registered during each of the regimes as well as the standard deviation1 of firm registrations which gives an idea of the volatility. We look at each of the phases separately.
1981-1990: This was the pre-liberalisation period when on an average 15,780 new firms got registered every year. In this period, the growth in firm formation was slow but consistent. The average yearly increase in new firm registration was around 10%. We saw positive growth throughout this period (except 1990) in a low volatility environment.
1991-2004: This phase started with slow growth in firm registration which reached its highest level in 1994-95. The number of firms formed in 1994 was roughly 1.4 times the number of firms formed in 1993. Similarly, the number of firms formed in 1995 was roughly 1.5 times the number of firms formed in the previous year. The highest growth rate in firm formation for the entire period under study was observed in the year 1995 at 46.9%.
However, starting in 1996, the consecutive drops of more than 20% for 3-years in a row (1996-1998) brought us down to the early 1990's level. We saw another major drop (30%) in 2001.
Figure 2. Structural breaks in new firm formation
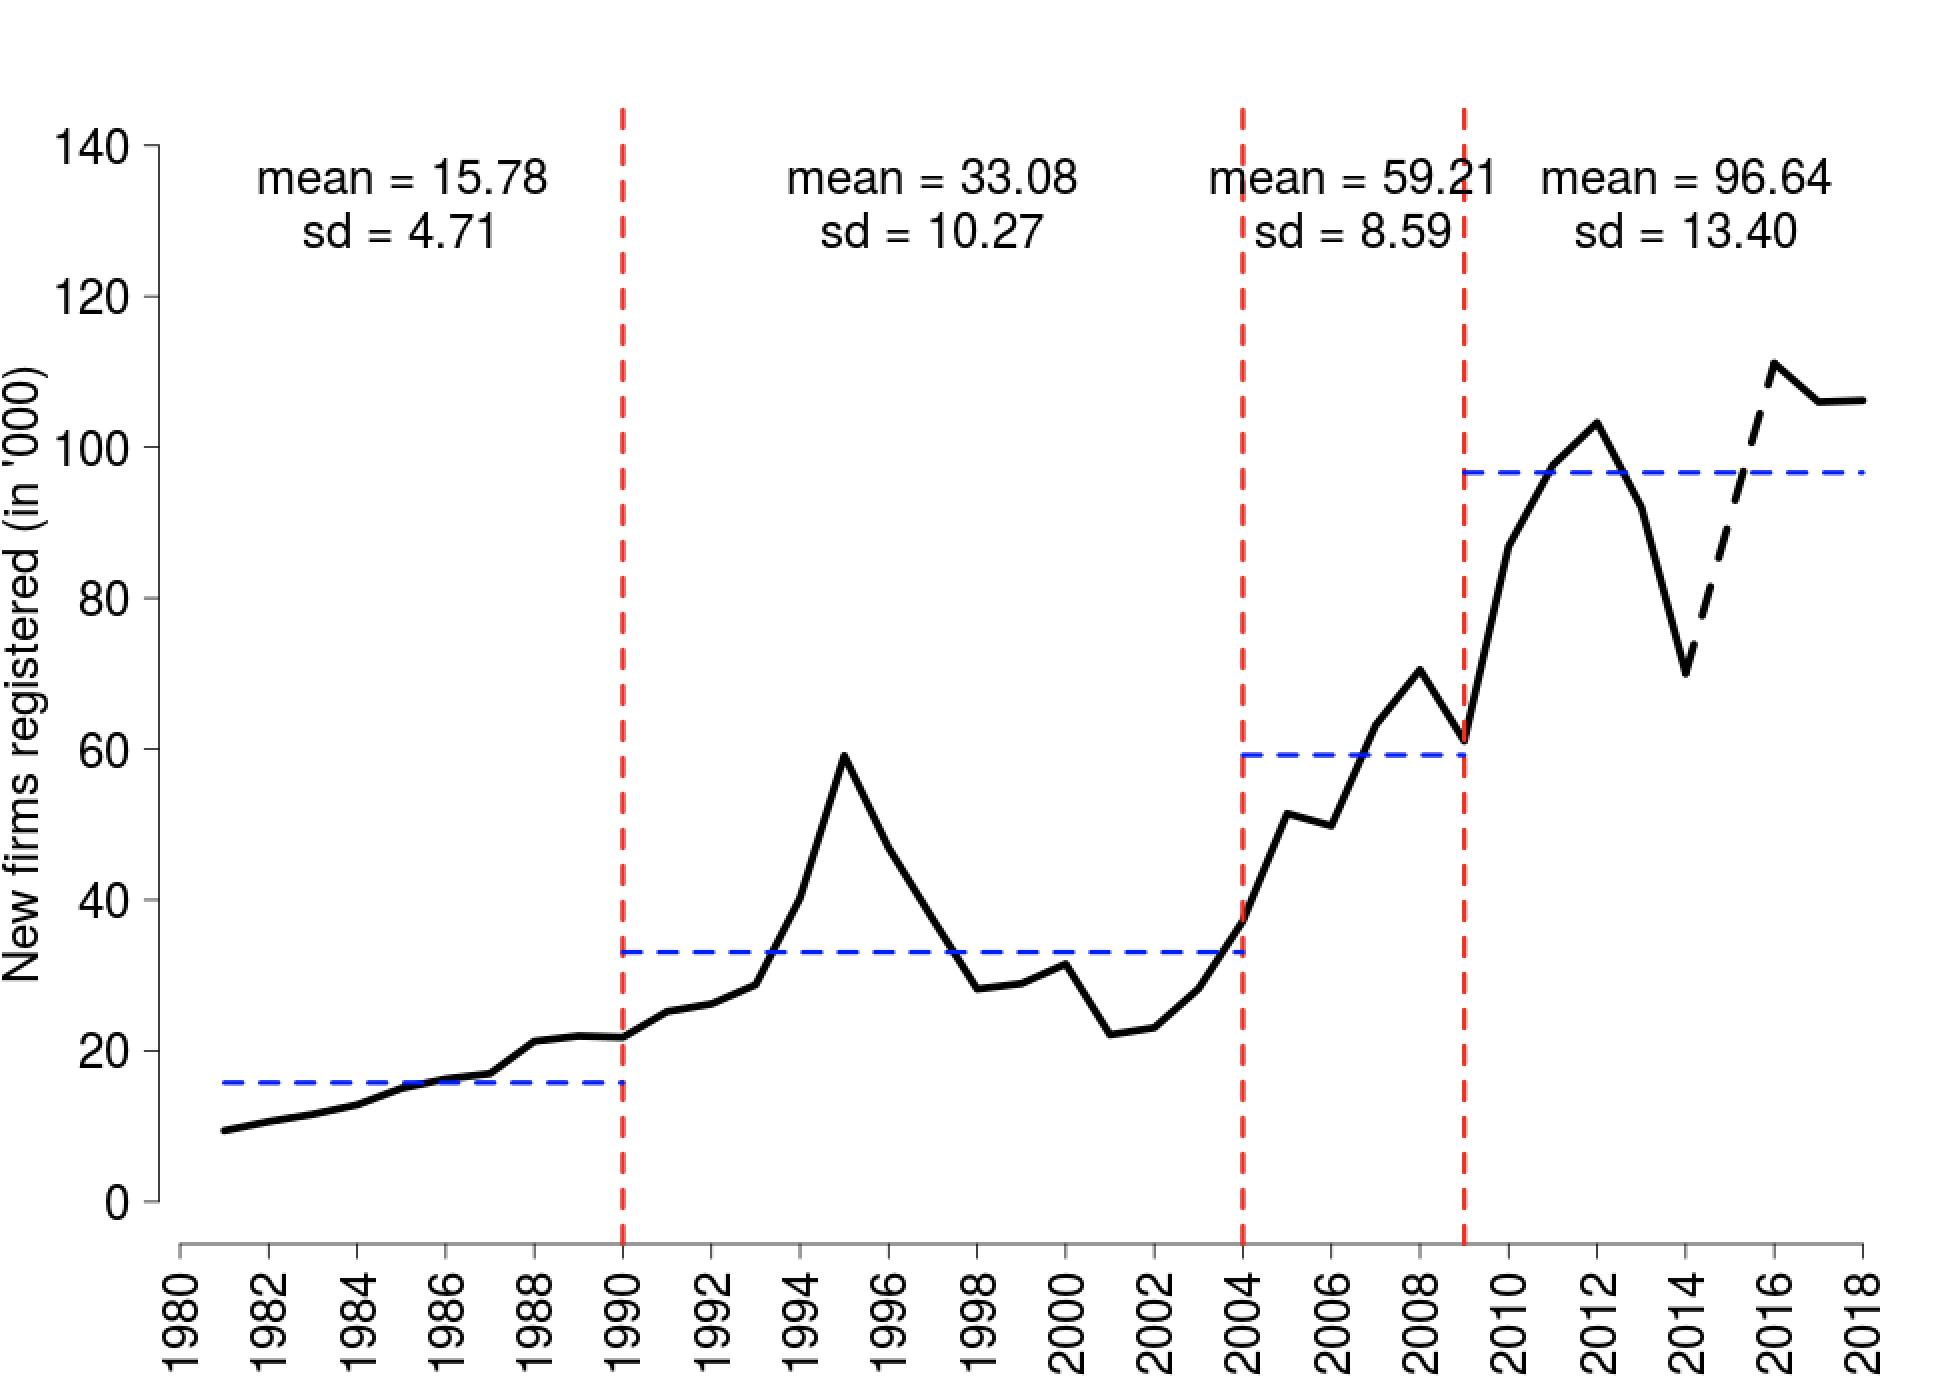
Note: ‘Sd’ refers to standard deviation.
Firm formation picked up by the end of the period with growth rates of 22.4% and 31.8% in 2003 and 2004 respectively. Note that throughout this period, we observe persistently high volatility in firm formation. Despite high volatility, the average firm formation was two times higher during this period compared to the previous regime.
2005-2009: In 2005, the growth momentum continued with 38% additional firm formation. There was a slight drop (3%) in 2006 but a strong recovery in 2007-08 (26.8% and 11.6% growth respectively), followed by another 13% drop in firm formation in the year 2009. On an average, we see an addition of twice as many new firms every year compared to the previous regime.
2010-2018: The period started with a quick and strong recovery in 2010 (42% growth). In 2012, for the first time more than 100,000 new firms got registered in India. There was a sharp drop in 2013 and 2014 (roughly 11% and 14% respectively). In 2016, the numbers went back up and remained stable above the 100,000 benchmark. More than 100,000 firms were consistently added between 2016 and 2018. On an average, 1.5 times more firms were added every year compared to the previous phase. This period also witnessed the highest volatility in firm registrations.
Major events and firm formation
It is interesting to correlate the periods of high- and low growth in new firm formation with economic recessions, national elections, and other macroeconomic shocks. In Figure 3 we juxtapose some of the main events witnessed over the last 40 years against the new firm registrations.
Figure 3. Major events and firm formation
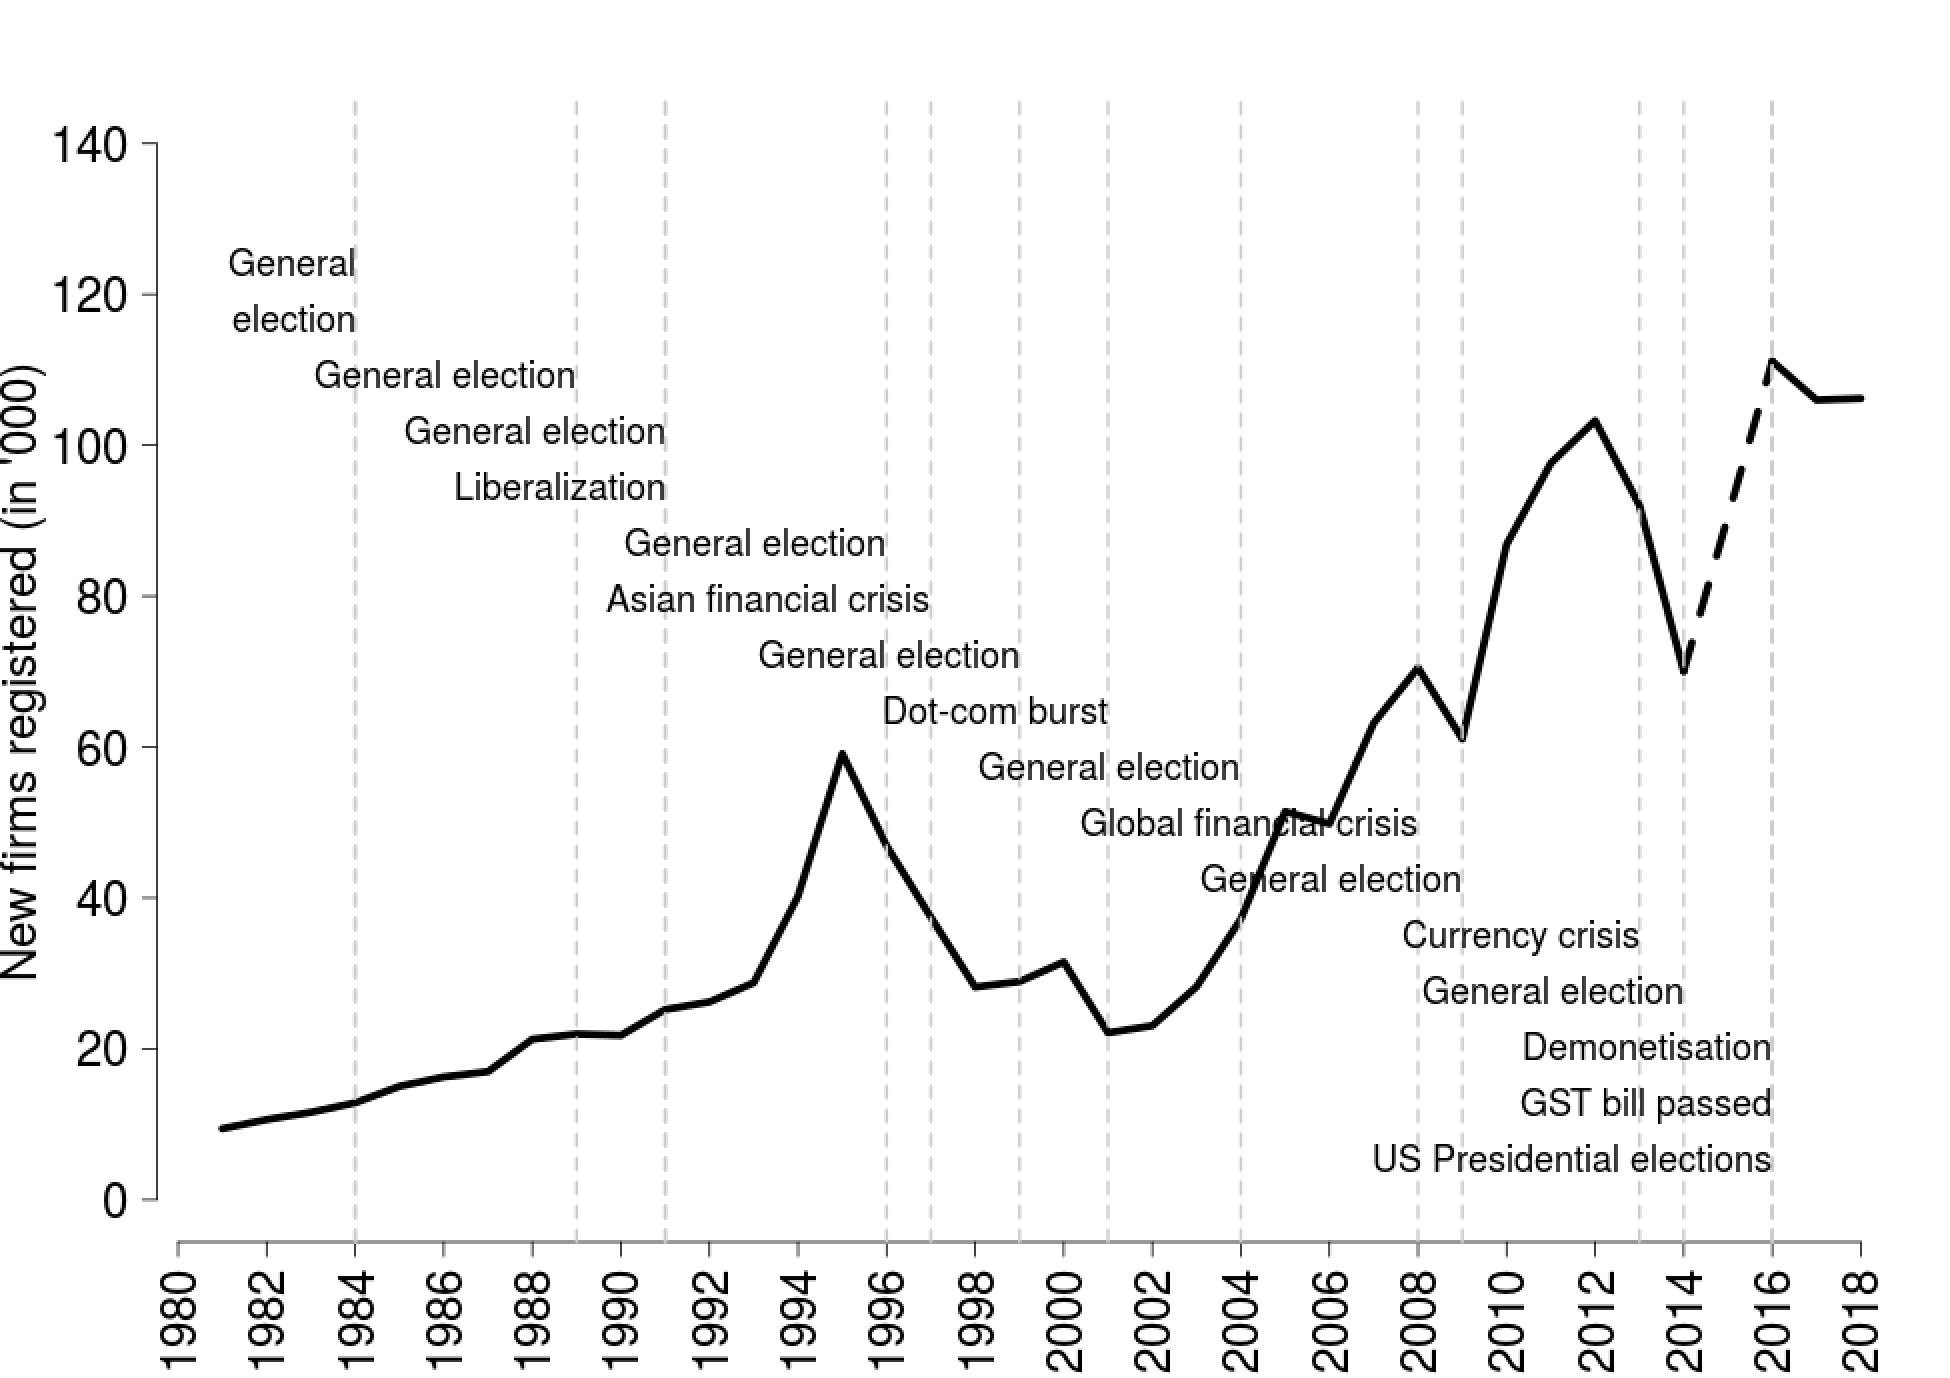
A glance at the graphical correlation tells us that during the pre-liberalisation period, on average national elections did not seem to have much of an effect on new firm registrations. Of course we have no way to assess the counterfactual here, that is, whether firm formation would have taken place at a faster pace had elections not been held during these years. During 1980-90, firm formation grew slowly but steadily through three elections.
Firm registrations fell in the run-up to the 1996 general elections and continued to fall during the Asian Financial Crisis of 1997 which brought about significant macroeconomic uncertainty in India. Firm registrations picked up only slightly in the run up to the 1999 elections but again dropped at the onset of the dot-com crisis in 2001.
From 2002 onwards, firm formation began growing at a remarkable pace which continued till 2012. During this 10-year period, on average roughly 65,000 new firms registered every year and the annual average growth rate in new firm formation was 17.5%. The increase was however not a smooth one. There was a sharp drop in the aftermath of the 2008 global financial crisis and in the wake of the 2009 general elections.
Firm formation fell rapidly in 2013 which was the year of a currency crisis in India following the taper tantrum episode. New firm registrations also fell sharply during the election year of 2014. We do not have the data for 2015 but the data for 2016 shows more than 100,000 firms being registered. The numbers however came down during 2017 and 2018 – arguably the years that felt the adverse impact of demonetisation, the newly introduced Goods and Services Tax (GST) as well as slowdown in bank credit growth.
Conclusion
Our results suggest that new firm formation in India has steadily grown over the last 40 years. Agglomeration economics suggests that incumbents in local industries influence entry rates of new firms. In a previous article we find that there has been a noticeable shift in industrial base across Indian states. This shift combined with the finding that new firms have been growing steadily over the years hints at a structural change in the corporate landscape of India which opens up several interesting research questions.
Increase in the annual rate of new firm formation implies shifting concentration of economic activity away from a limited number of firms to a large number of new entrants. This potentially reduces the dependence on a few large firms. This kind of a distributional shift over a long period of time can have important aggregate implications. Systemic risk goes down if economic activity is less concentrated in a few sectors or in a few large firms. More new, young firms also mean diversification in economic activity.
There is literature suggesting that incumbent firms are more affected by adverse macroeconomic shocks whereas new entrants promote economic recovery. This is especially true in context of the 'creative destruction' theory (Schumpeter 1961). It might also be interesting to analyse whether adverse economic shocks reduce the number of new entrants temporarily.
Notes:
- Standard deviation is a measure that is used to quantify the amount of variation or dispersion of a set of values from the mean value (average) of that set.
Further Reading
- Ghani, E, WR Kerr and SD O'Connell (2011), ‘Spacial determinants of entrepreneurship in India’, National Bureau of Economic Research (NBER) Working Paper 17514.
- Bahaj, S, A Foulis and G Pinter (2017), ‘Monetary policy and the firm: Some empirical evidence’, Paper presented at the First Annual Workshop of the ESCB Research Cluster 1 on Monetary Economics at the Banco de España, Madrid.
- Bhatia, S, M Singh and S Thomas (2019), ‘The geography of firms and firm formation in India’, The Leap Journal, 1 March 2019.
- Moreira, S (2017), ‘Firm dynamics, persistent effects of entry conditions, and business cycles’, Center for Economic Studies Working Paper 17-29, US Census Bureau. Available here.
- Klapper, L, R Amit and MF Guillén (2010), ‘Entrepreneurship and Firm Formation across Countries’, NBER Chapters, in J Lerner and A Schoar (eds.), ‘International Differences in Entrepreneurship’, pages 129-158, National Bureau of Economic Research, Inc.
- Pandey, R, I Patnaik and A Shah (2016), ‘Dating Business Cycles in India’, Working Papers 16/175, National Institute of Public Finance and Policy.
- Klapper, Leora, Luc Laeven and Raghuram Rajan (2006), “Entry Regulation as a Barrier to Entrepreneurship”, Journal of Financial Economics, 82(3): 591-629. Available here.
- Schumpeter, JA (1961), Capitalism, Socialism and Democracy, Ninth edition, George Allen & Unwin Ltd.

Comments will be held for moderation. Your contact information will not be made public.