

 12 June, 2019


The dynamic process of new firm formation and exit of weaker firms contributes to the evolution of industries and expansion of the economy. This article analyses the status of all new firms formed in India over 1981-2011, and their survival over time. It finds that, on average, roughly 45% of new firms survive more than 20 years. Apart from the surviving firms that are active, another 20% of the firms become dormant, which raises some concerns.
In any economy, firms are the entities that undertake investment, create jobs, and produce output. The dynamic process of new firm formation and exit of the less productive or weaker firms contributes to the evolution of industries and expansion of the economy. Understanding the patterns of firm entry and exit, and analysing the conditions in which these events take place can shed valuable light on how the economy is performing and how its various sectors are functioning. There exists extensive literature – both theoretical and empirical – on the analysis of firm entry and survival of the new entrants (see for example, Dunne et al. 1988, Baldwin and Gorecki 1991, Mata and Portugal 1994, Geroski 1995, Caves 1998, Segarra and Callejon 2002, among others).
In India, while significant attention has been devoted to studying the dynamics of firms' capital structure, firm demographics, that is, how the population of firms has changed over time and why, has not been explored. This is presumably because of data limitations. Publicly available data on all firms in the organised sector of the Indian economy can be obtained only from one source, the Ministry of Corporate Affairs (MCA) and even there, the availability of critical data fields is restricted.
Using the MCA data, in a previous article, we had presented an analysis of the total number of new firms formed in India over the last 40 years. We found that on average, 45,600 new firms got registered every year during the period 1980-2018. The registration of new firms in the formal sector grew at an average annual rate of 7.5% for the entire period.
While the analysis presented the trend in firm entry over the last four decades, it did not say anything about the status of these firms, for example, how many of these new firms still survive. It is possible that over the course of time, many of these firms have exited owing to business failures or other reasons. From the point of view of growth and development of the economy as well as the creation of employment opportunities and enhancing investment, what matters is the firms that have survived and that continue to be in operation.
In this article, we present and analyse the status of all the new firms formed between 1981 and 2011. Specifically, we look at the firm entry for every year of the sample period and study the survival rates of the new entrants.
Firm status
To define the status of the firms we use the classifications provided by MCA. The MCA database classifies firms into three broad categories: active, dormant, and inactive.
The first category consists of ‘active’ firms that are still in operation and are actively contributing to the overall economic activity. The second category of firms is those that are identified as 'dormant' under Section 455 of the Companies Act, 2013. These are kept dormant by their owners even though they are not involved in any business activity. Finally, 'inactive' firms are those that have been struck off from the database or liquidated or are under the process of being struck off or under liquidation. In other words, these firms have closed down or are in the process of closing down. It is the first category of 'active' firms that we consider as survivors.1
Figure 1 shows the status of firms that were incorporated between 1981 and 2011 (both included), as on 31 December 2015. Each bar corresponds to the number of firms registered in a particular year. The segments within a bar divide the firms incorporated in that year into the above mentioned categories. For example, of the 9,407 firms incorporated in 1981, 4,246 firms are active, 3,321 are inactive, and 1,840 are dormant as of 31 December 2015. To put these numbers in perspective, as of 31 December 2015, a total of 1,459,084 firms are registered in the MCA database. Out of these, 1,023,258 are active firms, 139,474 are dormant firms, 15,365 firms are in the amalgamated category, and 280,987 firms are inactive.
Figure 1. Status of firms formed every year over 1981-2011, as on 31 December 2015
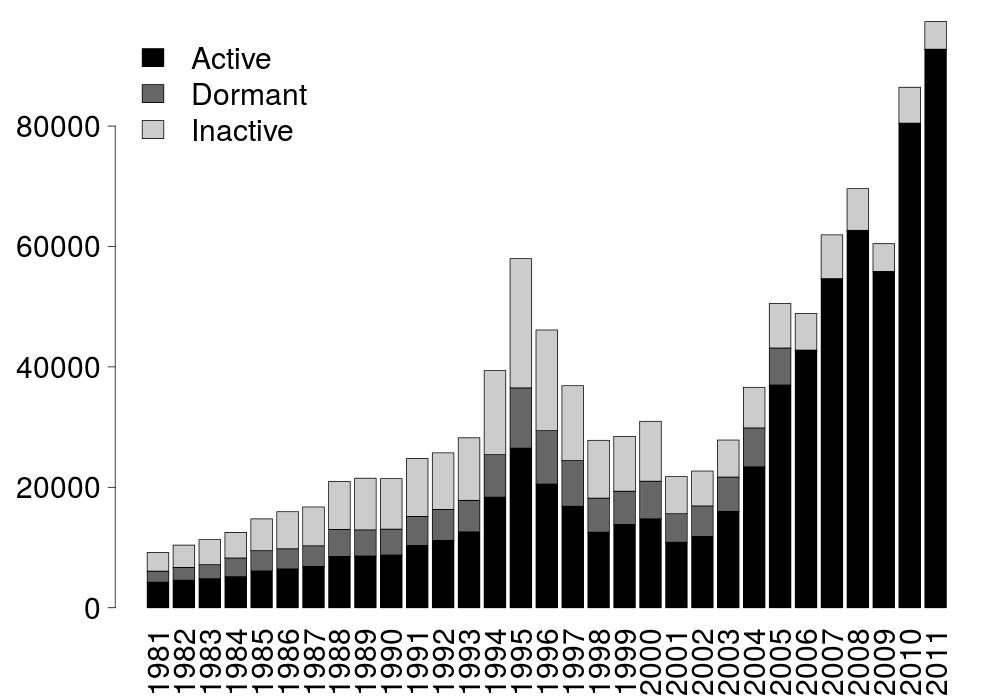
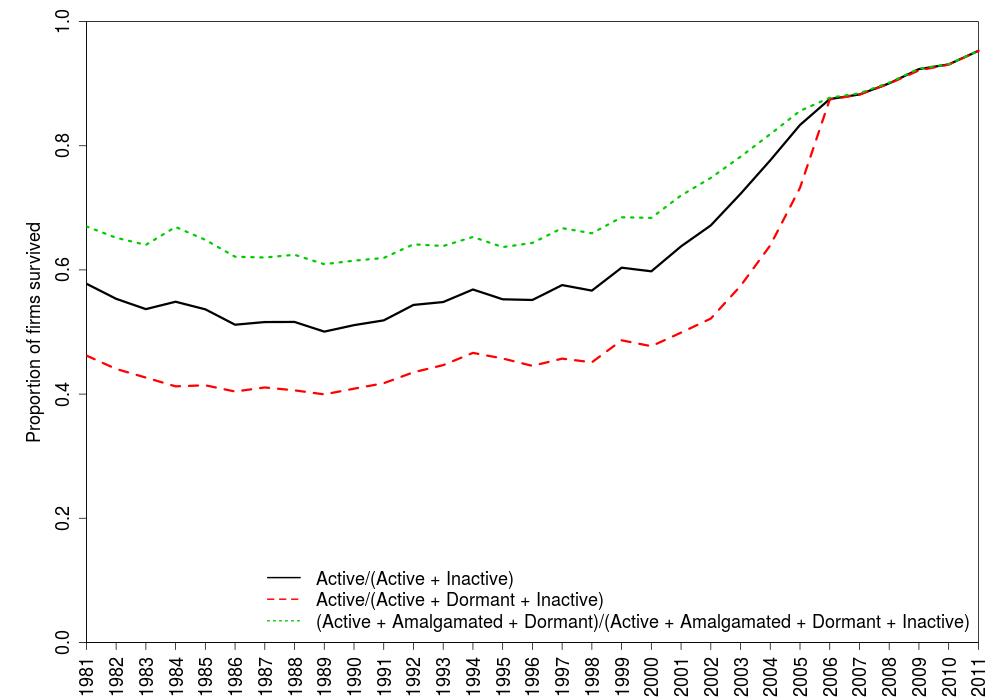
Figure 2 shows the survival rates of new firms by incorporation year, over the past 30 years. The survival rate for a given year is defined as the proportion of currently active firms out of all firms which were formed in that particular year. The graph shows three different estimates based on how we classify the dormant and amalgamated firms. The black line shows the proportion of firms that are operational as a proportion of total active and inactive firms. The red dotted line shows a conservative estimate where we consider all dormant firms as inactive. Note that some of the dormant firms might be still functional in the sense that they might not be taking any decisions but still fulfilling their pre-defined function. Finally, the green line shows a very optimistic estimate where we consider all amalgamated and dormant firms as active even when some of them are not necessarily currently active, as a proportion of all firms born in the same year.
Figure 2. Proportion of firms surviving till 31 December 2015
Survival by age
It is widely believed that only a handful of newly formed firms survive more than five years. However, our empirical evidence suggests otherwise. We found that on average, roughly 50% of new firms registered in India survive more than 20 years. This is equivalent to a survival rate of one out of two. This is way higher than other empirical studies (see Phillips and Kirchhoff (1988) for the US), where they found that the survival rate of newly formed firms after six years is roughly 40%. Even for considerably longer horizon (25-35 years), the firm survival rate in India is consistently very high.
If we look closely at the 10 years pre- and post-liberalisation, there is no substantial difference in firm survival rate. The average survival rate of the firms formed in the pre-liberalisation period (1981-1990) is 41%, while the average survival rate during the first decade of liberalisation and privatisation reforms (1991-2000) is around 45%.
The consistency of this pattern over nearly two decades suggests that these are not on account of firm-specific factors or time-varying macroeconomic factors. It is likely that other more structural issues are causing these patterns to prevail over time. More conservative estimates – considering all dormant firms as inactive – still suggest that more than 45% of newborn firms survive.
One possible reason for this high survival rate might be the limited competition in the market, and it would be interesting to further explore this factor. Another possible reason could be that firms change the sectors in which they operate but do not register themselves as new firms. Sapre and Sinha (2016) find evidence of misclassification of companies in the manufacturing sector using the MCA data. They find that several of these companies actually operate as wholesale traders or service providers. While they have changed their line of business since they were originally registered, this change does not get reflected in the identification code assigned to the companies at the time of registration. As a result they do not appear in the database as new firms.
Since 2000 we see a gradual and consistent positive slope suggesting a general negative relationship between firm survival and age. In other words, we find that firms formed in the more recent period exhibit a higher likelihood of survival as opposed to firms formed in earlier periods. Also, the survival rate improves for firms born in more recent years.
The literature is divided on the effect of age on firm survival. According to Geroski (1995), 'age' is positively related to the probability of firms' survival. Older firms have an established organisational structure, and, are more efficient compared to new entrants who take time to adapt themselves to a competitive environment and many of them end up exiting the business. However, a number of studies (Fichman and Levinthal 1991, Hannan 1998) have found that the probability of exit may increase with age. Older firms face a relatively high likelihood of exiting the market due to the erosion of technology, products, business concepts, and management strategies over time.
Looking at the data since 2000 (as of December 2015), it appears that in the case of Indian firms, the latter hypothesis holds, that is, younger firms have a greater chance of survival. However, in the absence of more data, we cannot draw any definitive conclusion about the relationship between firm age and firm survival at this stage.
Dormancy of firms: A concern
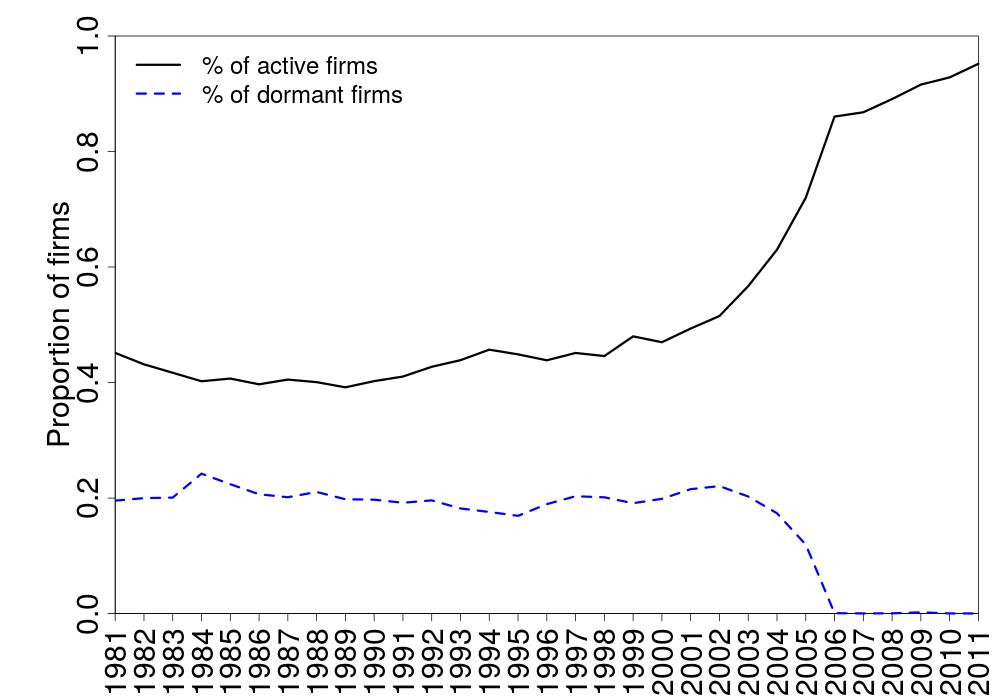
Apart from the active firms, the other interesting category is the dormant firms. Figure 3 shows the annual number of dormant firms as a proportion of the total number of new firms registered in a given year. We find that on average 20% of the new entrants (1981-2002) have consistently remained dormant over the sample period. The ratio is also stable in the pre- and post-liberalisation periods. This raises an interesting question: Why do the owners choose to keep these firms dormant instead of closing them down? Also, for how long do firms remain dormant and do they subsequently close down or get revived? Due to data constraints, we have no way of knowing when the new entrants become dormant, that is, how long do they remain active before becoming dormant, and what happens to the dormant firms eventually.
Figure 3. Proportion of dormant firms as on 31 December 2015
One reason for these high dormancy rates could be the cost. It may be cheaper to keep a firm alive in the dormant state than to exit and re-enter. Another reason could be the lack of exit options. For a long time, India did not have a coherent and effective mechanism for resolving insolvency of financially distressed firms. For many years the insolvency resolution landscape was a complex and fragmented one where it was difficult to resolve the insolvent firms or shut down the bankrupt ones in a quick and efficient manner (Sengupta, Sharma and Thomas 2017). As a result, many firms remained a part of the economy but did not meaningfully contribute to the overall economic activity. For all practical purposes their business model had failed but they had no way to exit the market or they exited only after many years had passed. It is possible that many of the dormant firms in our sample belonged to this category.
With the enactment of the Insolvency and Bankruptcy Code (IBC), 2016, firms in India now have access to a comprehensive insolvency resolution framework for the first time. The law became operational in 2017. More than 1,800 cases have been admitted under the IBC as of 31 March 2019. It will be interesting to check how many of the dormant firms in our sample are among those admitted. However, we are not able to do this analysis now for lack of further data from the MCA.
Inactive firms
Finally, with regard to the inactive status, on average about 36% of the new firms formed during the pre-liberalisation period of 1981-1990 have become inactive as on 31 December 2015. The rate was similar during the 1991-2000 period. On average 35% of the new firms formed during this period have shut down operations or are in the process of closing down as of 2015. The proportion of inactive firms is much lower for the recent years of 2001-2011 which is consistent with the high survival rate of firms born during this period. Only 15% of the new firms formed during this period have become inactive as of 2015.
Most empirical studies on firm exit consider age and size as the main determinants of firm exit. We, on the contrary, see a flat inactive status of firms across time (especially the first 20 years) which is quite non-intuitive. Inactive firms can also shed light on the process by which market evolves in a particular sector, and the changing demography and spatial distribution of existing firms, which can generate significant personal, social, and territorial costs. Once again due to data constraints, we are unable to analyse when these firms became inactive and why.
We do see the process via which they became inactive. More than 95% of inactive firms got struck off. If we consider striking off as voluntary termination due to business failure, we can infer that the majority of Indian firms became inactive voluntarily. Less than 2% of the firms got liquidated. This was perhaps due to the lack of an effective bankruptcy resolution framework till 2016. The most striking part is that there is only one firm in the entire dataset where the reason for inactivity is classified as ‘default’. This again is indicative of the non-existence of a proper exit route for defaulting firms during our sample period.
Conclusion
The consistency of the survival pattern, especially of the ‘active’ firms, over more than two decades, is an interesting finding worth exploring further. It raises several questions such as to what extent is this survival pattern an outcome of firm-specific factors, how much of this phenomenon can be attributed to time-varying macroeconomic factors, or is this just a salient feature of all emerging economies. Some of these results might also be driven by the changes in data collection and reporting standards over time. The cause and effect remain elusive at this stage for lack of sufficient data.
It is also possible that many of the ‘active’ firms that have survived for many years are in deep financial distress but they continue to function albeit inefficiently owing to lack of an effective exit option. With the IBC in place, it is possible that the dynamics of firm survival in India will undergo a big change. It will be interesting to explore this issue once more data become available.
The literature finds that compared to small firms, large firms may have better access to capital or labour markets which in turn improve their chances of survival. It would be interesting to investigate whether the larger firms in India enjoy better survival prospects. Also, do older firms face a relatively higher likelihood of exiting the market compared to the young firms? We need access to more detailed data to explore questions pertaining to the determinants of firm survival in India and the impact of the initial conditions at birth on the subsequent probability of firm exit and how all these may have changed with the implementation of the IBC. From a policy standpoint, it is important to understand the dynamics of firm survival as it may help throw light on the reform measures that need to be undertaken to help firms survive, grow, and contribute to the economy in a productive manner.
The authors thank Anjali Sharma for useful discussions.
Note:
- Another category of firms – ‘amalgamated firms’ – are those which got merged over time with other firms. Once amalgamated, the identity of the original firm no longer exists in the database but some part of the operations of the old firm will continue in the newly merged entity. We ignore these firms since they represent less than 1% of our population.
Further Reading
- Baldwin, John R and Paul K Gorecki (1991), “Firm Entry and Exit in the Canadian Manufacturing Sector, 1970-1982”, Canadian Journal of Economics, 24(2): 301–323.
- Caves, Richard E (1998), “Industrial Organization and New Findings on the Turnover and Mobility of Firms”, Journal of Economic Literature, 36(4): 1947–1982.
- Dunne, Timothy, Mark J Roberts and Larry Samuelson (1988), “Patterns of Firm Entry and Exit in US Manufacturing Industries”, The Rand Journal of Economics, 19(4): 495–515.
- Fichman, M and D Levinthal (1991), “Honeymoons and the Liability of Adolescence: A New Perspective on Duration Dependence in Social and Organisational Relationships”, Academy of Management Review, 16: 442–468.
- Geroski, Paul (1995), “What Do We Know about Entry?”, International Journal of Industrial Organisation, 13(4): 421–440.
- Hannan, Michael T (1998), “Rethinking Age Dependence in Organizational Mortality: Logical Formalizations”, American Journal of Sociology, 104: 126–164.
- Mata, José and Pedro Portugal (1994), “Life Duration of New Firms”, Journal of Industrial Economics, 42(3): 227–246.
- Phillips, Bruce D and Bruce A Kirchhoff (1988), “Formation, growth and survival; Small firm dynamics in the US economy”, Small Business Economics, 1(1): 65-74.
- Sapre, A and P Sinha (2016), 'Some areas of concern about Indian Manufacturing Sector GDP estimation', National Institute of Public Finance and Policy (NIPFP) Working Paper, No. 172/2016.
- Sengupta, R and M Singh (2019), ‘Firm formation in India: The last 40 years’, Ideas for India, 1 April 2019.
- Sengupta, R, A Sharma and S Thomas (2017), ‘Evolution of the insolvency framework for non-financial firms in India’, India Development Report, published by Indira Gandhi Institute of Development Research (IGIDR), Mumbai, India.

By: Arun Bhaskarrao Joshi 01 December, 2020
The authors should have prepared the cumulative statistics for every year.