

 25 September, 2015


India’s current account deficit widened consistently in the post-crisis period between 2008-09 and 2012-13. This column finds that while the public sector was the key driver of this trend in the first two years, the increased consumption/investment by households was responsible for the high deficit in the later period. It recommends that policymakers should now incentivise household savings rather than consumption/investments, which implies limited scope for further interest rate cuts.
From 1.4% of GDP (Gross Domestic Product) in 2007-08, India’s current account deficit (CAD) widened to a record level of 4.7% of GDP in 2012-13, before easing to 1.4% of GDP in 2014-15.
The public sector is widely believed to be the primary driver of the record-high CAD in 2012-13. According to the Economic Survey of 2014-15:
“…Juxtaposing savings with investment, it becomes clear that it was the large saving-investment gap of the consolidated public sector, complemented by a less pronounced gap in the private corporate sector, which could not be fully defrayed by the savings of households, that constituted the aggregate saving-investment gap…”
In a recent study, I seek to unearth the real drivers of high CAD in the period between 2008-09 and 2012-13.
Real drivers of high current account deficit in India in the post-crisis period
Investments in any economy are financed through domestic savings. If the former is greater than the latter, the economy will have to borrow from overseas by running a deficit on the current account. On the other hand, if savings are higher than investments, the economy will be a net lender to the rest of the world, reflected by a surplus on its current account. Further, any economy can be divided into three domestic sectors – households, private corporate (or businesses) and the consolidated public sector (including government-owned enterprises). Each sector is either a net lender/saver (savings > investments) or a net borrower (savings investments). The summation of net balances of these three sectors is the current account balance of an economy (after adjusting for errors and omissions).
Using sector-wise savings and investments data from the Central Statistics office (CSO), my analysis shows that although CAD widened consistently for five years between 2008-09 and 2012-13, the drivers were different during 2008-09 – 2009-10 and 2010-11 - 2012-13. Initially, the public sector was primarily responsible for high CAD; nevertheless, households, and not the government, were responsible for the high CAD later. Had the households maintained their net savings (savings minus investments)1 at the same level as in 2007-08, India’s current account would have ran a surplus of 2% instead of a deficit of 4.7% in 2012-13 (see Figure 1 below). In 2013-14, the improvement in CAD was also primarily because of higher (net) savings of households, as dissavings of the consolidated public sector increased.
Figure 1. Current Account Balance; 2006-07 – 2014-15 (estimated)
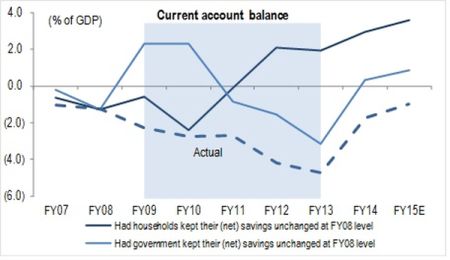 Notes: (i) Up to 2012-13, data is on 2004-05 base; 2013-14 data is on the revised 2011-12 base. (ii) 2014-15 figures are estimates.
 Source: Author’s calculations based on data from CSO and Reserve Bank India (RBI).
During 2010-11 – 2012-13, Indian households reduced their savings and increased their investments significantly as a result of which their net savings plunged from approximately 10% of GDP in 2009-10 to 4% in 2012-13. This marked the lowest level of net savings in almost the past four decades (since 1974-75). The fall is unprecedented in the history of Indian households. Notably, this behaviour of Indian households was not only at odds with their own history, but also in stark contrast with their foreign counterparts (the US households, for example). During 2008-09 – 2012-13, while Indian households reduced their savings, their US counterparts rebuilt savings from 5% in 2007-08 to 7.6% in 2012-13. Further, while US households lowered their investments from approximately 7% in 2006-07 to 3%, Indian households increased their savings from 11% to 16%. Consequently, US households turned from net borrowers in the pre-crisis period to net lenders - to the extent of 4.5% of GDP - in 2012-13 (Figure 2), giving a boost of more than six percentage points of GDP to the current account balance of the US. In contrast, the fall in net savings of Indian households worsened India’s CAD by more than six percentage points of GDP.
Figure 2. Saving/Investment of Indian households vs. US counterparts
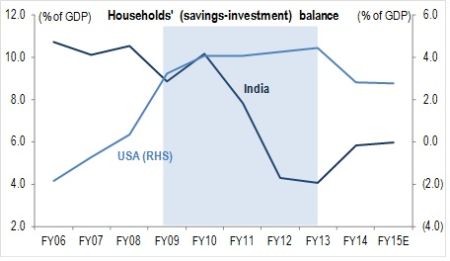 Notes: (i) Financial Year figures have been calculated for the US using quarterly data to make them comparable to Indian data. (ii) 2014-15 figures for India are estimates. Source: Author’s calculations based on data from CSO and RBI.
 What should policymakers do?
The government should walk the talk on fiscal policy by containing revenue spending, pushing capital expenditure and addressing constraints on receipts by hiking tax rates. Whether or not the new National Democratic Alliance (NDA) government at the Centre has made any difference to the real economy in its first year, the union budget for 2015-16 shows that the government is well aware of what needs to be done. Further, the government did not hesitate to revise its fiscal deficit consolidation roadmap. However, the real test lies in the implementation of the road map. In the first four months of the current financial year, the new government has performed well; however, it needs to be seen if the government continues to meet its target on capital expenditure by the end of the financial year.
My analysis suggests that policymakers should encourage savings and not incentivise consumption/investments by households: private consumption expenditure (PCE) growth averaged 8.4% in the three years to 2011-12, as against an average of 8.4% in the previous four years (2005-06 to 2008-09), implying that it did not suffer as much in India as in advanced economies. In fact, India’s PCE in the past five years grew at a rate faster than in the previous slowdown at the turn of this century. Nevertheless, investments by corporates halted, as the sector, in line with conventional wisdom, decided to borrow less and consolidate its accounts. Further, investments undertaken by households (in construction/real estate) and governments are generally less efficient than those of the private corporate sector. Not surprisingly then, the efficiency of India’s investments deteriorated during the global financial crisis. However, households seem to have realised that their incomes are not growing enough to maintain high spending. Consumption growth, accordingly, eased in the past couple of years. Nevertheless, households’ savings, which are the primary source of financing for domestic investments, failed to pick up. Thus, Indian authorities should avoid taking any measures to encourage consumption and discourage savings. This is because households’ incomes are unlikely to grow at a faster rate this year as incomes usually follow high corporate investments.
This leads to the conclusion that monetary authorities should avoid cutting policy rates excessively because of two reasons. Firstly, it may lead to lower deposit rates and hence lower savings; secondly, it may encourage borrowings and thereby lead to higher consumption of durable goods or more investments by households. Neither of these is needed at this point in time for the economy. Accordingly, I believe that the repo rate is unlikely to be cut below 6.5% by the end of 2016-17.
Notes:
- Household income – consumption = savings. Household savings have two parts: financial and physical. The former includes cash holding, bank deposits, insurance and pension funds, and equities/debentures. Physical savings primarily include real estate, which is equivalent to household investments.

Comments will be held for moderation. Your contact information will not be made public.