

 06 December, 2023


India’s large-scale family planning programme, Mission Parivar Vikas, improves access to contraception, offers monetary incentives to beneficiaries for programme adoption, and disseminates information on family planning with the objective of reducing the prevailing high rates of fertility in 146 districts. Using data from multiple rounds of the NFHS, this article documents evidence of a decline in number of births as a result of the intervention, accompanied by reduced fertility preferences of women and men, and increased adoption of contraception.
High fertility rates have been associated with poor maternal and child health and increased infant mortality (Bean et al. 1992). In developing countries, pregnancy has been known to be the leading cause of death among women aged 15-49 years (World Health Organization, 2023). Annually, about 3 million children are still-born (United Nations, 2014), while 4 million live-born children die within 4 weeks of birth (Haddock et al. 2008). At the national level, high fertility has also been linked with lower GDP per capita (Götmark and Andersson 2020).
Fertility decisions are complex, as they are affected by many factors such as social and economic wellbeing, religious and cultural beliefs, and peer pressure, making it difficult for governments to manipulate it through public policy alone. The ongoing efforts to manage the national fertility rate in China and Japan is testament to the importance and complexity of governments’ engagement and investment in reducing exceptionally high rates of childbirth.
Mission Parivar Vikas (MPV), launched in November 2016 by the Government of India, is a recent programme targeted at reducing fertility down to replacement levels (that is, 2.1 children per woman) in 146 districts with high fertility in the states of Uttar Pradesh, Bihar, Madhya Pradesh, Rajasthan, Jharkhand, Chhattisgarh, and Assam. MPV’s unique feature was its multi-pronged approach to reducing fertility. First, the programme improved access to contraceptives such as injectables, the oral contraceptive pill (OCP), intra-uterine contraceptive device (IUCD) and condoms through increased supply at public health centres. To encourage adoption of family planning practices, newly married couples were given pre-packaged kits with contraceptives, pregnancy test kits, and a pamphlet with information on family planning. Second, MPV focused on disseminating information on family planning to encourage the adoption of this increased supply of contraceptives. This was accomplished through quarterly campaigns and mobile vans plying in remote areas to disseminate best practices and benefits of family planning through audio-visual films, and conventions organized at local health centres to promote communication between women and their mothers-in-law and to influence their attitudes towards sexual and reproductive health. Third, these supply-focused and informational interventions were complemented with monetary incentives for the beneficiaries who successfully adopted contraceptives and sterilisation.
MPV was implemented through the existing Accredited Social Health Activist (ASHA) network. ASHAs are trained female community health activists who interface between the community and the public health system. They undergo extensive training after recruitment, receive continuous on-the-job training for women and child healthcare, and are familiar with the healthcare situation of their respective villages to which they are assigned.
In our study (Agarwal et al. 2023), we estimate the composite impact of these various interventions under MPV program – increased supply of family planning services, incentivising take-up of these services, and educating beneficiaries about the ill-effects of high fertility and encouraging adoption and use of these services – on fertility rates, as well as on the adoption of family planning practises and contraception usage in programme districts.
Methodology
To estimate the impact of MPV on the outcomes of interest, we exploit the variation in district eligibility for the programme. As mentioned earlier, MPV was launched only in 146 districts, which form our treated group. The remaining districts in the country (non-MPV districts) form our control group. Since MPV districts were chosen on the basis of prevailing high fertility, and are likely to have much higher average fertility than other districts in the country, simply comparing fertility rates in the treated group and the control group after programme implementation might not be accurate on account of the pre-existing differences across districts not caused due to the MPV program. To make the comparison fair, we use a difference-in-differences approach – first, we take the difference in fertility rates pre- and post-MPV. Next, we take the difference in these differences over time between MPV and non-MPV districts. This second difference is our estimate of the impact of MPV program. This method is employed mainly to eliminate the effect of pre-existing differences between the treated and the control groups. In addition to differences in the main outcomes of interest, we control for various covariates such as woman’s age, education, caste, religion, household head’s age and gender, rural residence as well as wealth, which could be correlated with these mean differences.
To implement the difference-in-difference methodology described above, we use the fourth (2015-16) and the fifth (2019-21) rounds of the National Family Health Survey (NFHS), which capture information on health, fertility, contraceptive usage, sterilisation, and exposure to family planning information for a representative sample of about 700,000 women in each round. Since the MPV programme was implemented in November 2016, NFHS-4 serves as the pre-programme data while NFHS-5 is the post-programme data.
Reliability of these estimates is conditional on the assumption that, in the absence of the programme (that is, in the counterfactual), the differences in the outcomes between treated and control groups would be statistically indistinguishable from zero. We test this assumption using pre-programme data from NFHS-2 (1998-99), NFHS-3 (2005-06), and NFHS-4 (2015-16). We compare the changes in fertility from NFHS-2 to NFHS-4 between MPV and non-MPV districts, and find that the results are statistically indistinguishable from zero. Essentially, we show that changes in fertility over time in MPV and non-MPV districts were not statistically distinguishable from each other before programme implementation. Thus, if we find statistically significant differences in fertility trends after MPV implementation, it can be attributed to the programme.
Results
A comparison of the average Total Fertility Rate (TFR) prevalent in MPV and non-MPV districts shows that from 1998-99 to 2015-16 (that is, before the implementation of MPV), TFR remained declined at a similar rate in both groups. However from 2015-16 to 2019-21, TFR in MPV districts declined faster than that in the non-MPV districts.
Figure 1. Trends in Total Fertility Rate in MPV and non-MPV districts
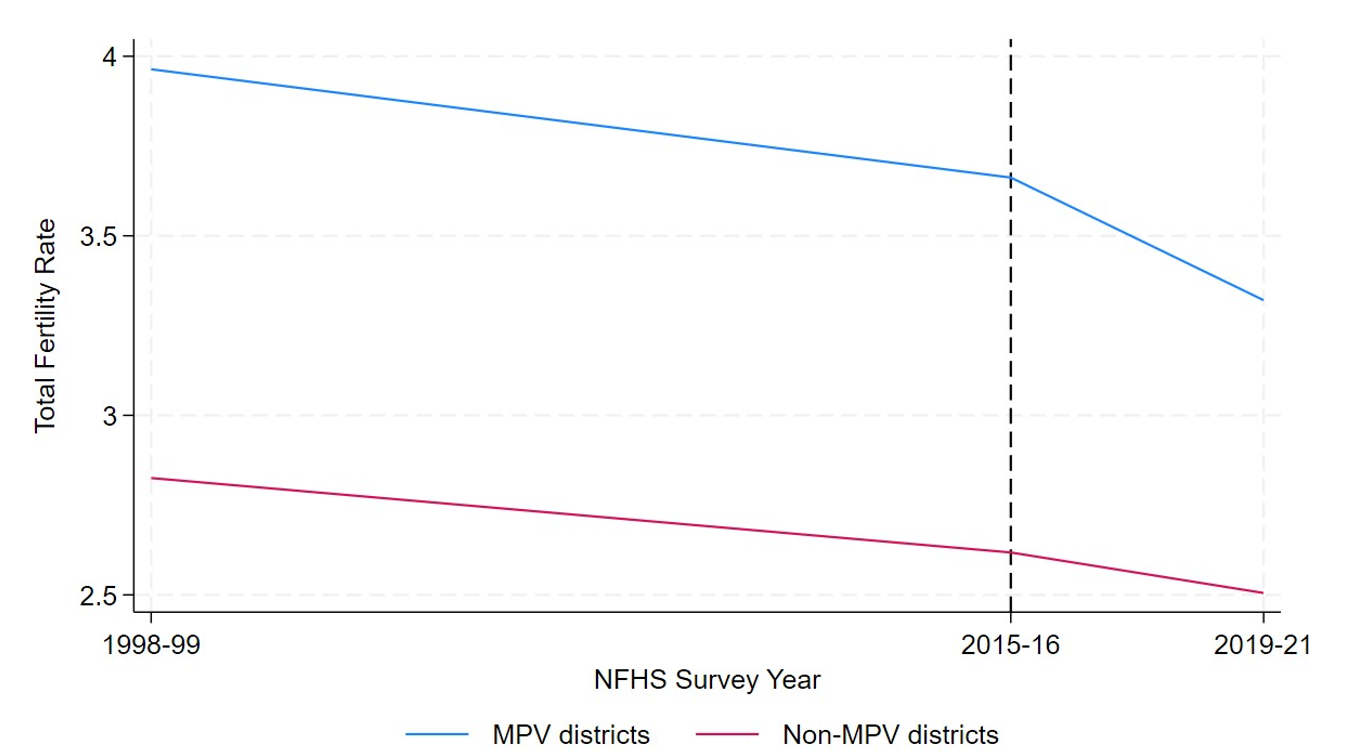
Notes: i) Average TFRs have been calculated using the women's data from NFHS-2, NFHS-4 and NFHS-5. ii) The dotted vertical line indicates the implementation of MPV.
Our main outcome variable to measure fertility is the number of births in five and three years preceding the fourth and fifth rounds of the NFHS survey. We find that a decline in the number of births after programme implementation in MPV districts, by 0.022 births in the last five years, and by 0.013 births in the last three years over than that in non-MPV districts. This translates to an effect size of approximately 5% fewer births. We also find that programme effects are stronger for districts with higher baseline fertility, and for nuclear households.
Figure 2. Impact of MPV on number of births in the last five (left panel) and three years (right panel)
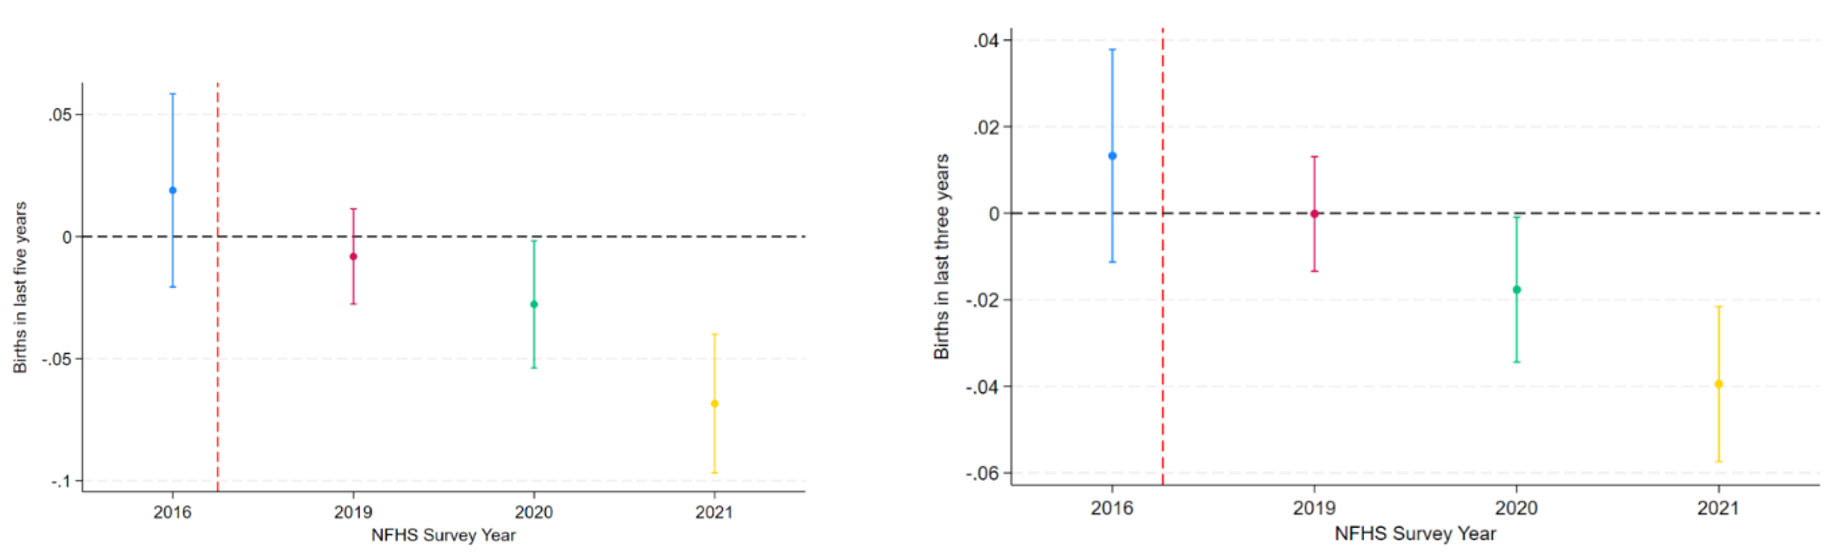
Notes: i) Point estimates are presented on the vertical axis along with the 95% confidence intervals. ii) The dotted vertical line indicates launch of MPV.
In Figure 2, we present results from an event study implemented at the year level, using different survey years over which NFHS-4 and NFHS-5 were conducted. The event study serves two purposes – showing evidence of programme effects (as seen in the negative point estimates in the figure) after implementation and showing that our empirical strategy is robust to pre-programme differences in fertility between MPV and non-MPV districts (which is evident from the statistically insignificant point estimate for pre-program year 2016).There is also a 1 percentage point reduction in the probability of being pregnant at the time of being recorded. In addition to realised fertility, we also find a reduction in women’s stated fertility preferences, measured by their opinion on the ideal number of children (lower in MPV districts by 0.07 births) and desire for more children (lower in MPV districts by 3 percentage points). Men’s reported fertility preferences also exhibit bigger decline in MPV districts. Decline in fertility preferences suggests that, in addition to immediate effects, MPV also shows promise for influencing couples’ decision-making criteria in the future.
We also find evidence of positive impacts of various interventions under MPV. As a result of information dissemination efforts, women in MPV districts were more likely to be exposed to family planning information through newspapers and magazines (2.8 percentage points), through television (7.5 percentage points), as well as through conversations with health workers (2.8 percentage points). Further, improved access to family planning resulted in increased usage of contraceptives (8.9 percentage points) and sterilisation (4.8 percentage points) among women. There was also evidence of use of contraception and sterilisation earlier in the fertility cycle. Men in MPV districts also exhibit an increase in usage of contraceptives and exposure to family planning information.
Decomposing effects on different contraceptives (Figure 3), we find positive impact on usage of female sterilisation, injectables, OCP, and condoms. An interesting ‘spillover' impact was the increased use and positive impact of the rhythm method to reduce the number of births1. While usage of other methods such as condoms or pills is constrained by availability and social stigma, rhythm method is completely demand-driven. An increase in usage of this method – which wasn’t a part of MPV interventions or recommended in its programme documents – might then be an indirect effect of the increased awareness of benefits of family planning, and health issues associated with high fertility, both of which were provided by MPV.
Figure 3. Impact of MPV on women’s contraceptive usage
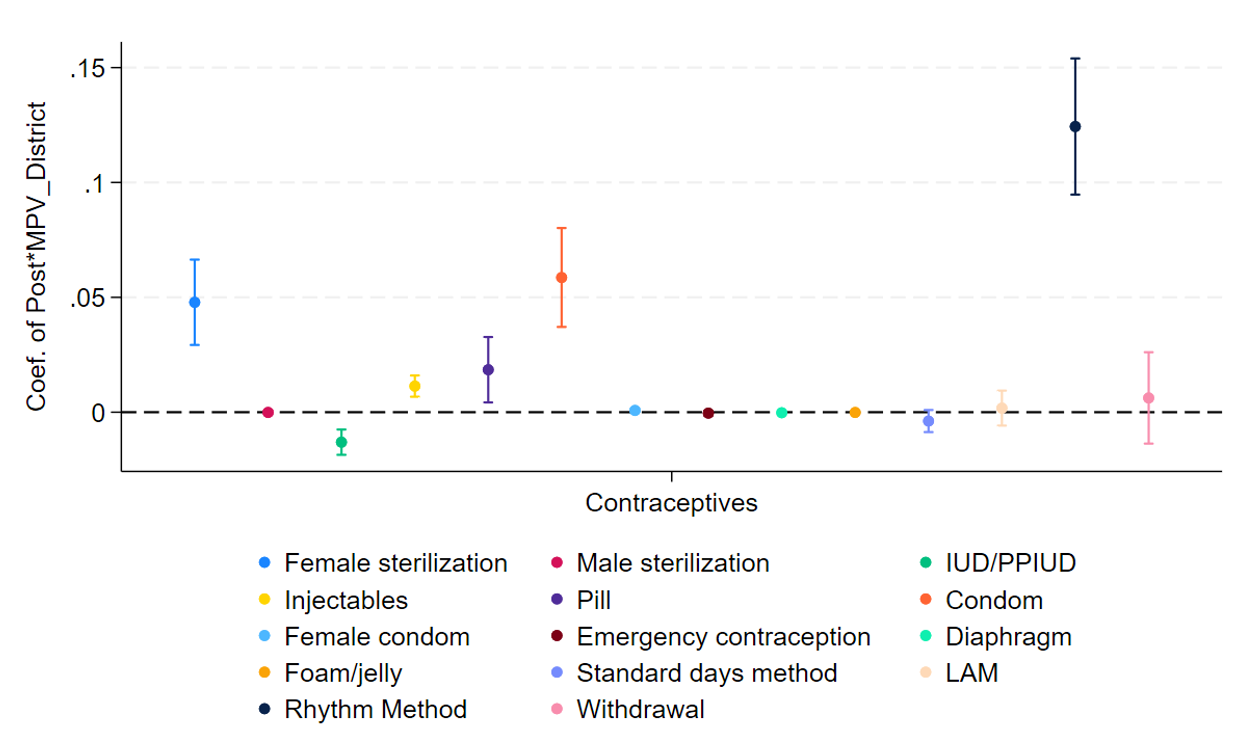
Notes: i) PPIUD refers to postpartum intrauterine device. ii) LAM refers to lactation amenorrhea method. iii) Results from our regressions are plotted on the vertical axis represented by the coloured dots along with the 95% confidence intervals. iv) The dotted horizontal line indicates zero effect.
Conclusion
High fertility is a public health concern, given its adverse consequences for maternal and child health at a micro-level, and negative association with GDP levels at an aggregate level. However, given the complexity involved in fertility decisions, it is difficult to manipulate fertility rates. Testament to the fact is the extremely slow reduction in fertility rates in some districts in India, despite governments’ long-standing efforts.
We find that the central government’s interventions under the umbrella of Mission Parivar Vikas were effective in reducing the incidence of childbirth and fertility preferences of potential beneficiaries, increasing the usage of contraceptives and sterilisation, as well as educating people about family planning, among both women and their husbands. While it may be too early to measure the impact on total fertility rate2, a reduction in post-programme births is a clear indication that MPV is a step in the right direction.
Notes:
1. The term rhythm method denotes the method of conception control where couples abstain from intercourse during certain periods based on calculations of the woman's fertile period (Schnepp and Mundi 1952).
2. Total fertility rate is measured over a woman’s reproductive period which spans many years, and hence is difficult to precisely estimate within only a few years after the launch of MPV programme.
Further Reading
- Agarwal, S, S Chatterjee and O Dey (2023), 'Family Planning in Mission Mode: Evidence from India’s Mission Parivar Vikas (MPV) Program', Working Paper.
- Bean, Lee L, Geraldine P Mineau and Douglas L Anderton (1992), "High-Risk Childbearing: Fertility and Infant Mortality on the American Frontier", Social Science History, 16(3): 337-363.
- Götmark, Frank and Malte Andersson (2020), "Human fertility in relation to education, economy, religion, contraception, and family planning programs", BMC Public Health, 20(1): 265.
- Haddock, S, E Leahy and R Engelman (2008), 'Population Growth', in HK Heggenhougen (ed.), International Encyclopedia of Public Health.
- Schnepp, Gerald J and Joseph P Mundi (1952), "Sociological Implications of Rhythm Method Practice", The Linacre Quarterly, 19(2): 44-49. Available here.

By: Khushboo Gupta 24 January, 2024
I'm wondering about the statistical model. Firstly, shouldn't there be a control for average rate of change in growth rate over last, say couple decades in a district? Secondly, would it need to be weighted? Referring to https://blogs.worldbank.org/impactevaluations/new-synthesis-and-key-lessons-recent-difference-differences-literature