

 31 July, 2013


In the context of the economic growth versus social development debate sparked off by Bhagwati and Sen, this column argues for a more nuanced approach to assessing progress. Combining nationally representative data on expenditure and social indicators for the different states in India, it explores the spatial dimension of the country’s economic development.
The recent exchange between two eminent Indian economists has been narrowly portrayed as a debate on which model to follow - one that focusses on market induced “economic growth” or one that stresses state spending and state-led policies to improve social indicators. In order to stir up frenzy, the media has not only portrayed the views of Bhagwati and Sen rather narrowly and unfairly and has exaggerated the distance between their views, but there are some wider issues on measurement that have been glossed over in the various commentaries. While Sen has been forced to stress that he is not anti-growth, and sees the importance of growth in securing economic advancement of the poor, Bhagwati has been at pains to stress that he is not talking of growth as a panacea and is not advocating the trickle down process whereby growth will automatically lead to improvement in social indicators. More absurdly, the debate has turned to the question: which state in India is a “model performer” – Gujarat, Kerala or Tamil Nadu? I pose the “model performer” question in the wider regional context: is it Western India with its faster rate of economic growth and economic affluence, or Southern India with its generally superior performance on social indicators? I draw on my recent research with others to argue here that the answer is neither. One positive externality of the Bhagwati-Sen debate is the attention it draws to the spatial dimension of India’s economic development and the limitation of exercises such as the International Comparison Project (ICP) that treats large countries such as India and Brazil as single entities.
Money metric measures versus social indicators of development
The wider issue that the debate raises is this: should one exclusively use money metric measures, such as income or expenditure, or social indicators based measures to assess progress? Even within a money metric measure such as expenditure, should we use total expenditure or should one narrow it down to only food expenditure? Fortunately, India is blessed with an abundance of data or, more precisely, data from the National Sample Survey (NSS) that concentrates on money metric measures and National Family Health Surveys (NFHS) that provide information on social indicators, to provide evidence on this issue. Do the NSS and NFHS always portray the same picture on the progress of the various states/ regions in the reforms and post reforms period? The answer again is no.
Majumder, Ray and Sinha (2012) have recently presented welfare rankings of states in India based on their per capita food expenditure, corrected for inequality in food expenditure in the respective states, using NSS data from rounds 50 (1993-1994), 55 (1999-2000), 61 (2004-2005) and 66 (2009-2010). The rankings are based on pair-wise comparisons, between states, of food expenditures evaluated at each other’s food prices using a methodology proposed by Sen in his 1976 paper in the Review of Economic Studies. The ranking of states does not always accord with conventional wisdom. In the rural areas, for example, Kerala and UP were right at the top at the start (NSS round 50 in 1993-1994), and even dominated Gujarat, but both these states slipped down the ladder during the period between NSS rounds 50 and 66 (2009-2010). The picture in the urban areas was quite similar. Urban West Bengal, generally regarded as a laggard state, was ranked much higher than perceived. Even within the expenditure based approach, the use of food rather than total expenditure, along with correction for inequality, makes quite a difference. The common perception that the affluent Western region is way ahead and the poorer Eastern region is way behind does not hold even on expenditure based figures.
Figures 1 (stunting and wasting rates) and 2 (neo-natal, infant and child mortality rates) present evidence on movement in social indicators by regions between NFHS-2 (1998-1999) and NFHS-3 (2005-2006). West Bengal is shown separately, in addition to being included in the graphs for the Eastern region, since this state had an uninterrupted Left rule and had quite a unique experience. Once again, the picture does not always accord with perception. For example, the West does worse than the South on both sets of child malnourishment rates (Figure 1). More significantly, West Bengal, notwithstanding the adverse media publicity it has received, does not do all that worse than the West. The South clearly dominates on both stunting and wasting. Note also that the picture is asymmetric between stunting and wasting - in most regions stunting has improved but wasting has deteriorated, except in the West where there has been an improvement in wasting as well. Figure 2 presents a similar picture on mortality rates. The affluent Western region with higher growth rates performs worse than the South and, more significantly, not all that better than the much maligned West Bengal. While any country-wide generalisation is fraught with danger, the one statement that holds for the entire country is that malnourishment and high mortality rates still prevail at uncomfortably high levels.
Figure 1. Rates of stunted and wasted children in NFHS-2 (1998-1999) and NFHS-3 (2005-2006)
 Source: Maitra and Ray (2013)
 Figure 2. Neo-natal, infant and child mortality in NFHS-2 (1998-1999) and NFHS-3 (2005-2006)
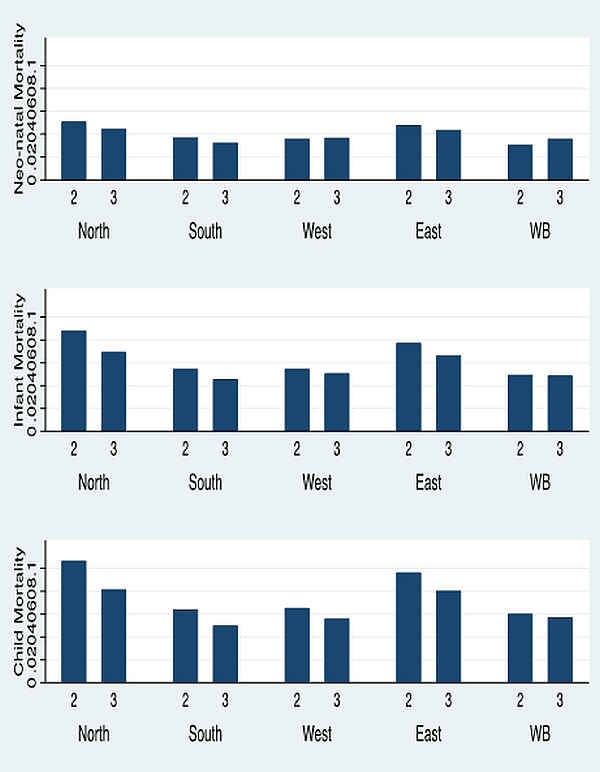 Source: Maitra and Ray (2013)
 Multidimensional measures of poverty
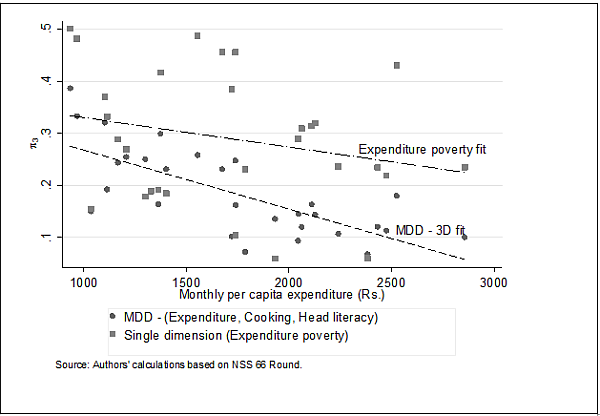
This brings me to the issue of the role of economic growth in reducing poverty. Figure 3 shows the state-level relation between multi-dimensional poverty, as measured by the Alkire and Foster (2011) measure, and per capita monthly expenditure. The top part of the figure shows the relationship using a liberal all-encompassing measure of deprivation, while the bottom part focusses on the most deprived households. Each half of Figure 3 shows the relationship for the non-health dimensions in the NSS, and also with the health dimensions added as in the NFHS. Both these figures point to the fact that with rising affluence that accompanies economic growth, multi-dimensional poverty based on a wide set of dimensions does decline. But the graphs also reveal a couple of interesting facts: (a) the graphs come down at a decreasing rate depicting decreasing returns to growth as far as social indictors are concerned, (b) there comes a point when the graphs plateau completely, and state intervention is required to achieve further progress, and (c) the NFHS based graphs lie uniformly above the NSS based graphs which suggest that the inclusion of health deprivation does lead to a bleaker picture on poverty. The graphs also suggest that the understatement of poverty or deprivation due to the omission of the health indicators in the NSS is particularly large for households in the more impoverished states.
Figure 3. Relation between multi-dimensional poverty and income/ expenditure (NSS-61 in 2004-2005 and NFHS-3 in 2005-2006)
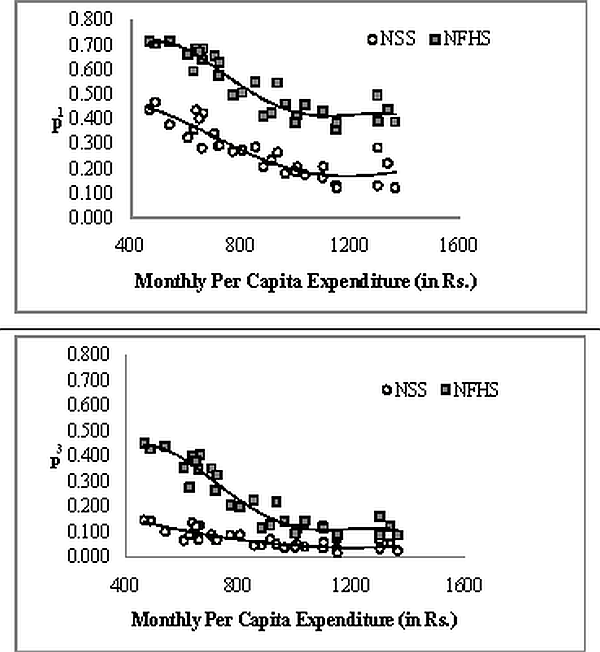 Source: Mishra and Ray (2013)
 Concluding thoughts
The point of this column is not to argue whether growth is important or not, or to claim that there is no divergence between the views of Bhagwati and Sen. Of course, growth is important and, of course, Bhagwati and Sen have sharply divergent views. Bhagwati argues that growth, along with less state controls, will yield improvement in social indicators while Sen argues that improvement in social indicators enhance capabilities and that will lead to growth. In adopting this ‘presidential’ style of debate, the media has trivialised the issue to the naive question of which is more important - economic growth, measured by money metric indicators or progress on quality of life, as measured by social indicators? A question posed in such terms fails to distinguish between an instrument such as economic growth, and outcomes such as superior health and education that are ends in themselves. One does not need to ask the question, where do superior health and education lead to, that one has to ask of economic growth. This column has shown that Western India that is regarded as the fastest growing region in India does not have a vastly superior performance on several social and demographic indicators. The translation of high growth rates and superior statistics on money metric measures to superior figures on social indicators is not all that clear cut. More generally, the link between perception, money metric measures and quality of life indicators is not as transparent as is commonly believed. Quite significantly, West Bengal that has attracted considerable adverse media scrutiny does not do that badly in relation to the all India averages on health indicators, though it does not do all that well either.
Further Reading
- Alkire, S. and Foster, J. (2011), “Counting and multidimensional poverty measurement”, Journal of Public Economics, 95, 476-487.
- Maitra, P. and R. Ray (2013), “Child Health, Neo-Natal and Child Mortality in West Bengal and Comparison with other Regions in India”, forthcoming in Economic and Political Weekly.
- Majumder, A., Ray, R. and K. Sinha (2012), “Spatial Comparisons of Prices and Expenditure in a Heterogeneous Country: Methodology with Application to India”, Discussion paper of Monash University, Economics Department, Melbourne.
- Mishra, A. and R. Ray (2013), “Multi-Dimensional Deprivation in India during and after the Reforms: do the Household Expenditure and the Family Health Surveys present consistent evidence?” Social Indicators Research, 110, 791-818.

Comments will be held for moderation. Your contact information will not be made public.