

 24 September, 2014


Kerosene – the primary fuel used by the poor in India for cooking and lighting – is made available at subsidised rates by the government through the Public Distribution System. This column seeks to estimate the extent of leakage of kerosene in the PDS. It is found that, on average, 45% of kerosene that is taken up by state governments does not reach intended beneficiaries.
The Public Distribution System (PDS) is operated jointly by the central and state governments to ensure the availability of essential commodities such as food grains, edible oils and kerosene, at subsidised rates. The central government, through the Food Corporation of India (FCI), manages the procurement, storage, allocation and transportation of these commodities whereas the state governments facilitate their distribution through a network of Fair Price Shops (FPS). Ration cards — distributed by state governments to “eligible” families – can be used to avail the commodities at subsidised rates from the FPS (Government of India 2001).
Kerosene serves as the primary fuel in India for cooking and lighting by the poor. According to Rao (2012), the kerosene subsidy benefits over 160 million households (or 800 million people), which constitute 66% of the population. The government spends heavily on kerosene subsidy (0.01% of Gross Domestic Product (GDP) in 2010-11) (International Institute for Sustainable Development 2012).
The PDS has been widely criticised for inefficiencies arising primarily from corruption. Some economists have attempted to estimate leakages (or diversion) of food grains supplied through the PDS (Khera 2011, Dreze and Khera 2011, Himanshu and Sen 2013). In my recent research, I attempt to investigate the extent of diversion of PDS kerosene1.
Examining extent of kerosene diversion under PDS
Leakages may occur either due to losses during transportation or storage or as a result of corrupt practices. States are allocated commodities as per their share (allocation) — decided on the basis of past consumption trends and reported number of Below Poverty Line (BPL) families – of which not all may get lifted by the states (the quantity of food grain that is lifted by the states is known as ‘off-take’). In the case of food grains, leakages are defined as the percentage of off-take not received by ration card holders.
For calculating kerosene leakages, we would need consumption data (what is received by ration card holders) and off-take data. To compute the average per capita purchase of kerosene, I use data from the 68th round of National Sample Survey (NSS) pertaining to 2011-12.2 The off-take data for kerosene is not available for the reference period, therefore allocation data is used. Data for other years shows that off-take is generally 98% of allocation for most states and hence, it is fine to use allocation data in lieu of off-take data3. State-wise data on allocation was obtained from two independent sources: one being a reply to a question raised in the Lok Sabha and the other, a data portal, IndiaStat.com. Data from the former source has been used for the analysis4 (Table 1).
Consumption data from the NSS is from the agricultural year (July 2011 – June 2012) whereas the allocation data is for the fiscal year (April 2011 – March 2012). In order to adjust for this mismatch, the average of the kerosene allocation data for the two fiscal years 2011-12 and 2012-13 has been taken. This averaging would effectively normalise any abnormal fluctuation that may have come up.
At the all-India level we observe that the kerosene leakage is around 45% (Table 1). Figure 1 shows state-wise leakage rates for all states. Two states clearly stand out. First, Tamil Nadu seems to be doing very well with 5% share in the total PDS kerosene allocation and the lowest leakage rate of 23.3%. At the other extreme is Delhi which records an exceptionally high leakage (close to 92%). However, one needs to understand that Delhi has a meagre share (0.6%) in the country’s total PDS kerosene allocation. Even if Delhi were to report a 100% leakage, the absolute amount of kerosene lost would be nearly half of what Tamil Nadu (with the lowest leakage rate) lost in 2011-12. Thus, it is important to look at allocation and leakage figures together.
Table 1. State-wise kerosene allocation, purchase and leakages, 2011-12

|
State |
Allocation (2-year average 2011-12 and 2012-13), kL |
Share (%) |
PDS Purchase (2011-12), kL |
Leakage (%) |
|
Andaman & Nicobar Islands |
7242 |
0.07 |
3,105 |
57.1 |
|
Andhra Pradesh |
498,402 |
5.02 |
309,947 |
37.8 |
|
Arunachal Pradesh |
11,592 |
0.12 |
2,768 |
76.1 |
|
Assam |
329,430 |
3.32 |
150,876 |
54.2 |
|
Bihar |
818,766 |
8.25 |
539,446 |
34.1 |
|
Chandigarh |
5,646 |
0.06 |
2,766 |
51.0 |
|
Chhattisgarh |
186,420 |
1.88 |
118,219 |
36.6 |
|
Dadra and Nagar Haveli |
2,382 |
0.02 |
1,330 |
44.2 |
|
Daman and Diu |
1,464 |
0.01 |
921 |
37.1 |
|
Delhi |
57,642 |
0.58 |
4,714 |
91.8 |
|
Goa |
12,618 |
0.13 |
5,019 |
60.2 |
|
Gujarat |
673,584 |
6.79 |
316,822 |
53.0 |
|
Haryana |
126,168 |
1.27 |
37,111 |
70.6 |
|
Himachal Pradesh |
28,806 |
0.29 |
11,407 |
60.4 |
|
Jammu and Kashmir |
94,890 |
0.96 |
56,796 |
40.1 |
|
Jharkhand |
270,132 |
2.72 |
116,440 |
56.9 |
|
Karnataka |
531,216 |
5.35 |
294,181 |
44.6 |
|
Kerala |
161,160 |
1.62 |
79,639 |
50.6 |
|
Lakshadweep |
1,014 |
0.01 |
700 |
31.0 |
|
Madhya Pradesh |
626,196 |
6.31 |
339,240 |
45.8 |
|
Maharashtra |
1,102,266 |
11.11 |
442,263 |
59.9 |
|
Manipur |
25,344 |
0.26 |
3,677 |
85.5 |
|
Meghalaya |
26,004 |
0.26 |
7,341 |
71.8 |
|
Mizoram |
7,836 |
0.08 |
3,234 |
58.7 |
|
Nagaland |
17,100 |
0.17 |
578 |
96.6 |
|
Odisha |
400,356 |
4.03 |
217,501 |
45.7 |
|
Puducherry |
7,554 |
0.08 |
2,660 |
64.8 |
|
Punjab |
188,220 |
1.90 |
44,322 |
76.5 |
|
Rajasthan |
511,182 |
5.15 |
294,346 |
42.4 |
|
Sikkim |
6,468 |
0.07 |
1,288 |
80.1 |
|
Tamil Nadu |
516,798 |
5.21 |
396,288 |
23.3 |
|
Tripura |
39,222 |
0.40 |
25,292 |
35.5 |
|
Uttar Pradesh |
1,592,424 |
16.05 |
898,142 |
43.6 |
|
Uttarakhand |
72,726 |
0.73 |
45,341 |
37.7 |
|
West Bengal |
964,596 |
9.72 |
598,176 |
38.0 |
|
NE States |
462,996 |
4.67 |
195,055 |
57.9 |
|
India |
9,922,866 |
100 |
5,444,185 |
45.1 |
Figure 1. Percentage of leakage of PDS Kerosene in Indian states
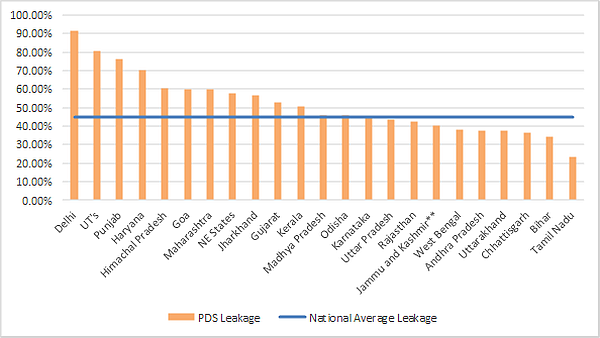
The total collective share of the so-called BIMARU (Bihar, Madhya Pradesh, Rajasthan and Uttar Pradesh) states in allocations is 36%. Given that these states are considered to be relatively poor and economically backward, and have a high share in total allocation, it is important to take a close look at them. Interestingly, their leakage rates range from 34-46%. Among these states, Bihar has the lowest leakage rate (34%), well below the national average and second only to Tamil Nadu. On the other hand, the estimate for Madhya Pradesh is almost 46%, close to the national average.
An interesting contrast is the performance of the ‘daughter’5 states (Chhattisgarh, Jharkhand and Uttarakhand) with the respective ‘parent’ states (Madhya Pradesh, Bihar and Uttar Pradesh respectively). Do the daughter states do better? There appears to be no pattern here, with Jharkhand doing worse than Bihar, whereas the other new state doing better than their parent states.
The North Eastern states, get a small share of PDS kerosene allocation (just under 5%), but in per capita terms, allocation of kerosene (10.18 litres per capita) turns out to be the highest in the country (the national average is 8.20 litres). The entire North Eastern region, with the exception of Tripura, has high estimated leakages. The average leakage of the North eastern states is 57.9%, which is much higher than the national average.
Comparing kerosene and grain leakage under PDS
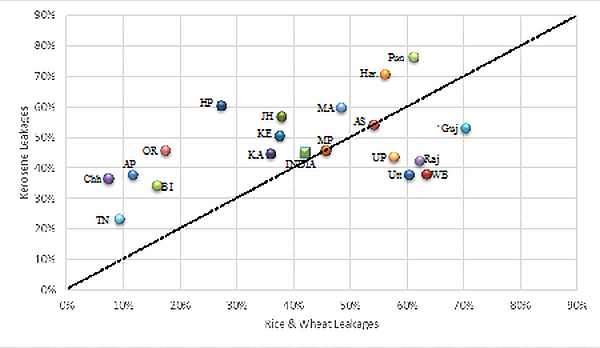
Finally, I plot PDS kerosene leakages against PDS food grain leakages in Figure 2 (taken from Khera 2014) to see whether the leakage patterns are the same across commodities. At the all-India level it is observed that both leakages are between 40% (for food grains) and 45% (for kerosene). Barring a few states (undivided Uttar Pradesh, Rajasthan, Gujarat and West Bengal), kerosene leakage is higher than food grain leakage. It is by now reasonably well known that in some states, there has been an impressive turnaround in the PDS between 2004-05 and 2009-10. It would have been interesting to see if the reduction in estimated leakage of food grain is also observed in the case of kerosene. Unfortunately, since kerosene allocation data is not easily to obtain, I have not been able to do so. Nevertheless, the estimate presented here could be considered a start towards tracking kerosene leakages.
Figure 2. Comparison of kerosene and food grain (rice and wheat) leakages
Notes:
- This research was done for a project supervised by Reetika Khera. I gratefully acknowledge her guidance and valuable feedback.
- The per capita purchase was initially calculated, but later to maintain uniformity and eliminate discrepancy, these numbers were taken from the NSS report published by Government of India (2014).
- For 2011-12, only four states’ off-take was less than 98% of allotted quantity.
- There is one important difference between the two sources. The former uses kilolitres (kL) as the unit whereas the latter uses tonnes. This difference in units could result in an error of as high as 25%. In the absence of any form of authentication, I have used the information provided in the Lok Sabha question.
- In the year 2000, Government of India created three new states, Chhattisgarh, Jharkhand and Uttarakhand by reconstituting the existing states of Madhya Pradesh, Bihar and Uttar Pradesh respectively. The reason for this move was socio-economic and therefore, it is an interesting exercise to compare the parent-daughter pairs.
Further Reading
- Drèze, Jean and Khera, Reetika (2011), ‘PDS Leakages: The Plot Thickens’, The Hindu, 12 August. Available online: http://www.thehindu.com/opinion/lead/pds-leakages-the-plot-thickens/article2351414.ece
- Government of India (2001), ‘The Public Distribution System’, Economic Survey 2000-2001, Ministry of Finance, New Delhi, Ch. 5.1. Available online: http://indiabudget.nic.in/es2000-01/chap53.pdf
- Government of India (2014), ‘Household Consumption of Various Goods and Services in India, 2011-12, NSS 68th Round’, National Sample Survey Organization, Ministry of Statistics and Programme Implementation, New Delhi, Report No. 588.
- Himanshu and Abhijit Sen (2013), “In-Kind Food Transfers - I: Impact on Poverty”, Economic and Political Weekly, Vol. 48, No 45&46, pp. 46-54.
- International Institute for Sustainable Development (2012), ‘A Citizens Guide to Energy Subsidies in India’.
- Khera, Reetika (2011), “Trends in Diversion of Grain from the Public Distribution System”, Economic and Political Weekly, Vol. 46, No. 21.
- Khera, Reetika (2014), ‘Taking Stock: The National Food Security Act and the Public Distribution System’, Available online at http://web.iitd.ac.in/~reetika/
- Rao, Narasimha D (2012), “Kerosene Subsidies in India: Why Energy Policy Fails as Social Policy”, Energy for Sustainable Development, Vol. 16, pp 35-43.

Comments will be held for moderation. Your contact information will not be made public.