

 08 November, 2017


As per official data released on 31 August 2017, the Indian economy grew at 5.6% in the first quarter of the current fiscal year – in congruence with forecasts of National Council of Applied Economic Research. Based on the quarterly and annual models of NCAER, Bornali Bhandari discusses recent trends in key economic indicators, and future growth forecasts.
India has undertaken several policy measures in a space of less than a year. The two key initiatives that had the largest immediate impact were the demonetisation exercise carried out in November 2016, and the implementation of the Goods and Services Tax (GST) in July 2017. The economy is still adapting to the new tax system and there have been implementation challenges. It is a perilous task to forecast the growth rate of a country in these transitioning times.
Impact of demonetisation
On the face of it, the impact of demonetisation seemed transitory with the worst being over by January 2017. The NCAER (National Council of Applied Economic Research) Business Sentiments Survey showed that the Business Confidence Index after falling by 16% in January 2017, recovered by 24.6% in April 2017 on a quarter-on-quarter basis, falling again by 2.5% in July 2017 (See Figure 1 below).
Figure 1. NCAER Business Confidence Index: July 2014 to July 2017
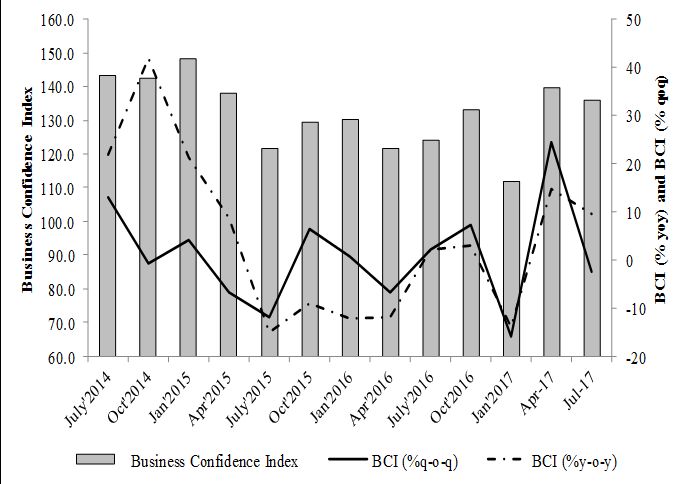 Source: NCAER Business Expectations Survey
 However, there were two consequences: First, on the agricultural sector; and second, on the macroeconomy − setting off a chain of events. The 4th advance estimates released on 16 August 2017 by the Department of Agriculture indicate record foodgrain production (275.5 million tonnes). Foodgrain production during the Rabi season is estimated to be higher in 2016-17 versus 2015-16. Total production of oilseeds, cotton, and jute are estimated to be higher in 2016-17 relative to 2015-16. However, sugarcane and mesta production are estimated to be lower in 2016-17 versus 2015-16. The agricultural sector has come under distress, partly because of the paradox of plenty: surplus food means lower prices for farmers, putting a downward pressure on their income. Agricultural infrastructure, such as cold storage, in India remains work-in-progress at best. The Economic Survey 2016-17 indicates that small farmers (with holdings less than 2.5 hectares) depend much more on informal sector credit than those with larger landholdings. The second factor was the cash and credit squeeze in the agricultural economy between September 2016 and May 2017 (Economic Survey 2016-17). These factors worked together to put the agricultural sector in distress. To alleviate agricultural sector distress, farm loan waivers were announced in Uttar Pradesh, Karnataka, Maharashtra, Punjab, and Tamil Nadu (Economic Survey 2016-17). This in turn affects states’ fiscal deficit adversely.
The second consequence of demonetisation was on the macroeconomy. Excess liquidity was injected into the system, which continues to persist. Liquidity was in excess of US$2,500 billon even in the last week of June 2017 (Economic Survey 2016-17).
Recent trends in economic indicators
Meanwhile a stable macroeconomic environment, being labelled as one of the fastest-growing countries, and political uncertainty in the US and UK has made India attractive to foreign investors especially in terms of debt flows. Foreign Portfolio Investment showed year-on-year (y-o-y) growth of 654.5% in the first quarter (Q1) of 2017-18. The Sensex continues to show double-digit growth in Q1 of the current fiscal year (Table 1). Foreign reserves have soared, growing by 7.7 % in June 2017 (Table 1). Consequently, Q1 saw appreciation of the rupee by 3.6%.
Table 1. Recent trends in selected economic indicators
| % Change y-o-y | 2016-17 | 2016-17 | 2016-17 | 2016-17 | 2017-18 | 2017-18 | 2017-18 |
| Q1 | Q2 | Q3 | Q4 | April | May | June | |
| I. Growth environment: Index of Industrial Production (IIP) (2011-12) | |||||||
| Mining | 7.5 | -1.5 | 6.7 | 7.9 | 3.2 | 0.2 | 0.4 |
| Manufacturing | 6.6 | 5.5 | 2.9 | 1.6 | 3.2 | 2.6 | -0.4 |
| Electricity | 10.0 | 3.1 | 6.1 | 4.3 | 5.4 | 8.3 | 2.1 |
| General | 7.1 | 4.5 | 3.7 | 2.7 | 3.4 | 2.8 | -0.1 |
| II. Price environment | |||||||
| Wholesale Price Index (WPI) (2011-12) | |||||||
| Primary articles | 4.6 | 4.8 | 1.2 | 3.1 | 1.0 | -1.7 | -3.9 |
| Fuel, power, etc. | -13.6 | -6.8 | 1.7 | 21.3 | 17.1 | 11.8 | 5.3 |
| Manufacturing | -0.6 | 0.8 | 1.9 | 3.3 | 3.1 | 2.6 | 2.3 |
| All commodities | -0.7 | 1.0 | 1.7 | 5.0 | 3.9 | 2.3 | 0.9 |
| Consumer Price Index (CPI) Combined (2012=100) | 5.7 | 5.2 | 3.7 | 3.6 | 3.0 | 2.2 | 1.5 |
| III. Monetary/Capital market variables | |||||||
| Sensex | -4.1 | 4.7 | 2.9 | 17.5 | 16.8 | 16.8 | 14.5 |
| M3 | 10.0 | 13.7 | 6.2 | 10.2 | 6.0 | 6.8 | 7.3 |
| Reserve money (RM) | 14.9 | 14.8 | -28.8 | -12.9 | -10.6 | -8.7 | -7.1 |
| Bank credit to commercial sector (BCC) | 8.9 | 12.1 | 4.8 | 8.1 | 4.1 | 4.8 | 5.7 |
| London Interbank Offered Rate (3 months; %)* | 0.6 | 0.8 | 0.9 | 1.1 | 1.2 | 1.2 | 1.3 |
| IV. External account | |||||||
| Exports (US$ merchandise) | -2.1 | -1.4 | 6.0 | 17.3 | 19.8 | 8.3 | 4.4 |
| Imports (US$ merchandise) | -14.5 | -13.1 | 2.8 | 25.1 | 49.1 | 33.1 | 19.0 |
| Exchange rate Rs./US$ (+ depreciation/- appreciation | 5.5 | 3.1 | 2.2 | -0.8 | -2.9 | -3.7 | -4.2 |
| Brent US$/barrel* | 46.0 | 45.8 | 50.1 | 54.1 | 53.1 | 50.9 | 46.9 |
| Forex currency assets (US$) | 2.0 | 5.9 | 2.2 | -2.6 | 3.0 | 5.4 | 7.7 |
Notes:
- * These are actual values and not y-o-y change.
- Conversion from monthly to quarterly: Most data are averages except BCC. (iii) Exports and imports have been summed. (iv) Last month values have been taken as quarterly values for M3, RM, and foreign currency assets.
- M3 is a measure of money supply which consists of currency with the public + demand deposits with the banking system + ‘other’ deposits with the RBI + time deposits with the banking system.
Data source: Official statistics accessed from various sources.
The Index of Industrial production (IIP) has fallen continuously between March 2017 (4.1%) and June 2017 (-0.1%). Weak investment activity continued to plague the Indian economy. Gross Fixed Capital Formation as a ratio to GDP (gross domestic product) had fallen from 31% in 2016-17 :Q1 to 28.5% in 2016 -17:Q4 . The IIP of capital goods has been in recession in 2017-18:Q1 and IIP of infrastructure goods grew barely by 0.2% and 0.6% in May and June of 2017, respectively. Further, the growing problem of banks’ non-performing assets continues to act as a drag on the Indian economy.
However, the services sector remains optimistic as evidenced by tourist arrivals, cargo traffic in railways and ports, and aviation passenger traffic. Bank credit to the commercial sector (BCC) was very weak in the first quarter (Table 1).
This first quarter showed significant weakening of inflation. International crude oil prices showed a sharp fall from US$50.9 per barrel in May 2017 to US$46.9 in June 2017. CPI (Consumer Price Index) food and fuel inflation were at -0.9% and 5.3% in 2017-18 :Q1.
Last but not the least, while merchandise imports showed persistent, strong growth, merchandise and services exports showed signs of weakening in May and June 2017. Service sector exports grew barely by 0.1% in first quarter and imports by -6.6%.
In sum, the first quarter showed weak inflation and industrial activity. Some service sectors like tourism, aviation traffic, and cargo carried by railways showed resilient growth. The agricultural sector continued to show distress.
All the indicators in the quarterly model have been updated to 2011-12 base prices. The trade-off is that all the variables are available only from April 2012, thereby significantly limiting the degrees of freedom1. With this caveat, the forecasts from the quarterly model are used. However, it did a better job of anticipating the slowdown in the first quarter than the annual model.
Growth estimates
The results from the quarterly model are presented in Table 2. The model forecasted 6.6% growth for 2017-18. The forecasts were a significant downward revision from earlier estimates of 7.2% in June 2017. The abysmal performance of the industrial sector had a significant downward impact on GVA (gross value added)2 estimates. The quarterly model correctly predicted on 24 August 2017 that first quarter growth of GVA at Basic Prices at 2011-12 prices would be 5.6%.
Table 2. Quarterly GVA at Basic Prices estimates for 2017-18
| January 2017 (%) | June 2017 (%) | 24 August 2017 (%) | |
| 2017-18:Q1 | 6.9 | 6.8 | 5.6 |
| 2017-18:Q2 | 8.3 | 7.1 | 6.5 |
| 2017-18:Q3 | 6.5 | 7.4 | 7.0 |
| 2017-18:Q4 | 6.4 | 7.6 | 7.4 |
| 2017-18 | 7.0 | 7.2 | 6.6 |
Source: NCAER computations.
The following are the assumptions for 2017-18 growth forecasts of the quarterly model:
Prices: The WPI (Wholesale Price Index) inflation is predicted separately using statistical modelling3. It is predicted to be 1.9% for this fiscal and 2.3% for 2017-18 :Q1
Rainfall: For 2017-18, based on IMD (India Meteorological Department) forecasts, 98% of the Long Period Average is assumed here. It shows y-o-y growth of 0.9%.
Bombay Stock Exchange: The assumption is revised upwards from 10% y-o-yincrease in 2017-18 to 12.9%, given the first quarter data. The y-o-y growth in the first quarter was 16%.
BCC: The BCC y-o-y growth is assumed to be 6.9% this year. The y-o-y growth in the first quarter was 5.7%.
Total expenditure at the Central level: A y-o-y growth of 6.6% is assumed here based on Union Budget documents.
This article is based on the forecast that was presented at the NCAER Quarterly Review of the Economy on 24 August 2017. Views are personal and do not necessarily represent those of the organisation that the author is affiliated with.
Notes:
- Degrees of freedom are the number of values in a study that the freedom to vary.
- Gross value added (GVA) is broadly defined as the value of output less the value of intermediate consumption. It measures the contribution to an economy of an individual producer, industry, sector or region.
- The Autoregressive Integrated Moving Average (ARIMA) model is used to predict WPI inflation.

Comments will be held for moderation. Your contact information will not be made public.