

 05 October, 2012


Is economic growth the best way to reduce poverty, raise life expectancy, and improve people’s health? This column looks at different Indian states over the last 20 years. It argues that governments that pursue economic growth cannot be accused of neglecting their social aims.
The frenzied downgrading of India’s economic growth prospects, at the same time as the government has stepped up its social spending, raises an important question about the consequences for ‘social outcomes’, such as people’s health and standard of living. How important is growth for such social outcomes? This question deserves some careful and dispassionate analysis, over longer and shorter time horizons.
One virtue of India being a union of states is that it serves as a laboratory for social scientists. With different states implementing different policies, we can treat these multiple policies as experiments, comparing states that received the ‘treatment’ of one policy with other states that did not (the ‘control’ group). This helps economists and other social scientists draw conclusions about what works and what doesn’t. Often this has to be done across countries, but in India the union of states means we can do this in one country.
Consider state-level data on four key social outcomes – poverty, life expectancy, child malnutrition, and inequality. The relationship between income and each of the social outcomes is depicted in the four Figures below. The long-run nature of the relationship can be assessed by plotting the level of the social outcome, say the level of poverty, (on the y-axis) against the state’s level of economic development (measured on the x-axis by state per capita GDP). The Figures (1-4 below) are for the most recent period for which data are available.
Figure 1. Income and Poverty, 2009
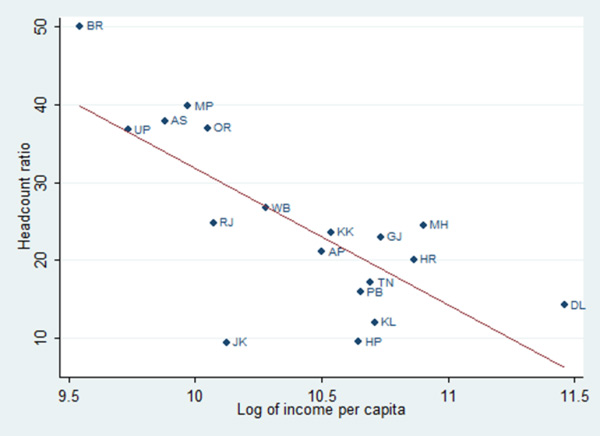 Income per capita refers to net state domestic product (NSDP) per capita. 2009 refers to FY 2009-2010 and so on. NSDP per capita is in 2004-05 prices. NSDP per capita is calculated using data from CSO. Headcount ratio is from the table on pg. 45 of the Databook for the Deputy Chairman, Planning Commission. Data are based on the Tendulkar methodology. Data for Jharkand, Uttarakhand, and Chattisgarh are included in their parent states.
 Figure 2. Income and Health, 2004
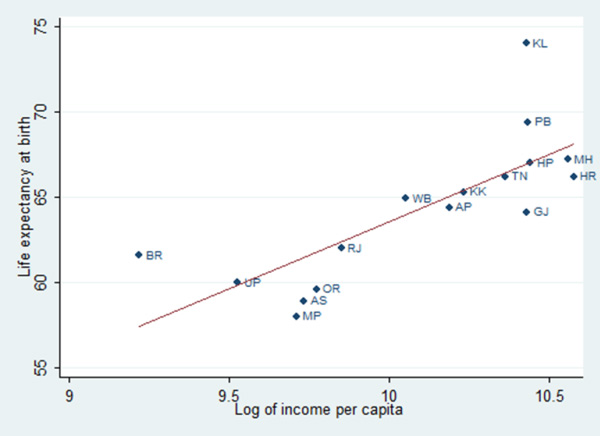 Data for 2004 are from SRS Based Abridged Life Tables 2002-2006.
 Figure 3. Income and Child Health, 2005
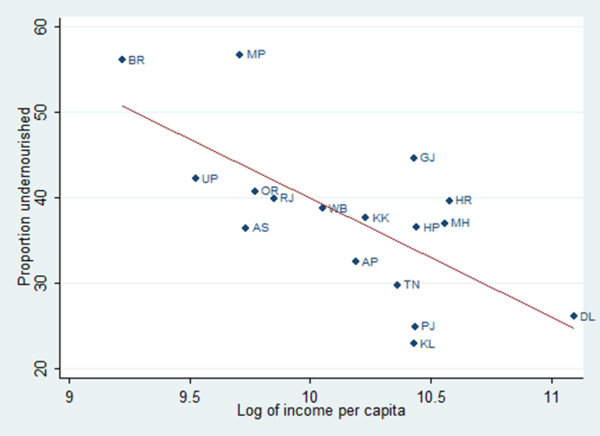 Malnutrition data are from the National Family Health Survey III (Table 10.2). Proportion undernourished is the share of children below 5 years in 2005 whose weight-for-age is two standard deviations below an international norm. Data reflect the states as they existed before the 2000 division.
 Figure 4. Income and Inequality, 2004
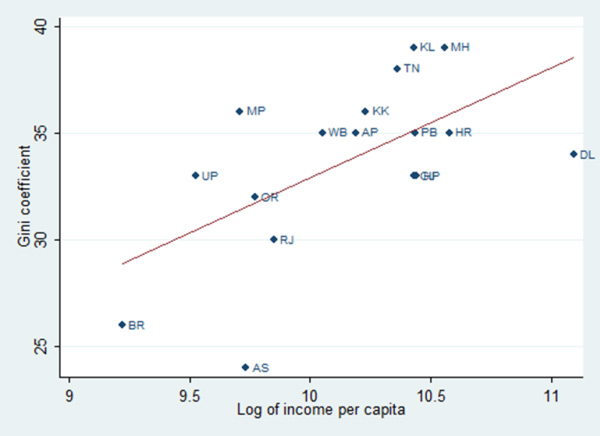 Data on the Gini coefficient of consumption inequality are from Bhandari and Debroy (2007), Table 2.
To assess the impact over the medium run, in particular over the reform period, we can plot changes in each social outcome against changes in the standard of living, the latter measured as the growth rate of state per capita GDP (Figures 5-7). The changes are calculated between the early 1990s and late 2000s (for poverty), or the mid-2000s (for life expectancy and inequality), with the precise dates dictated by data availability. (Changes cannot be assessed for child malnutrition because consistent data across time are not available.)
Figure 5. Growth and changes in poverty, 1993-2009
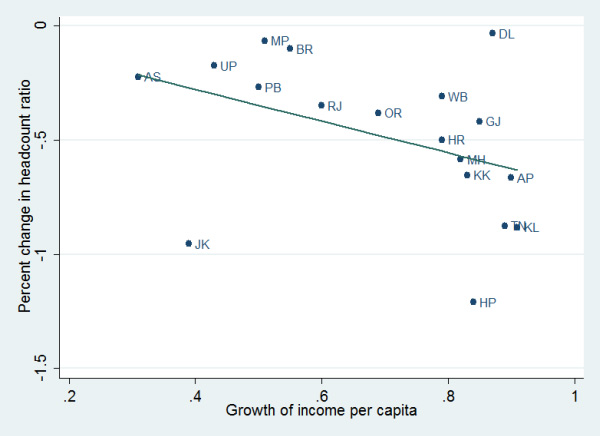 Growth of income per capita is calculated as the difference in the log of net state domestic product per capita (NSDP) per capita over time.2009 refers to FY 2009-10 and so on. NSDP per capita is in 2004-05 prices and is from the CSO. In all the Figures, the percentage change in the social outcome is calculated after taking account of, and removing, the convergence effect. Headcount ratios are from National Planning Commission, Annexure B of the 2009 Expert Group Report Poverty Report and the Table on pg. 45 of the Databook for the Deputy Chairman, Planning Commission. Data for 1993 and 2009 are based on the Tendulkar methodology. Data for Jharkand, Uttarakhand, and Chattisgarh are included in their parent states.
 Figure 6. Growth and changes in life expectancy, 1990-2004
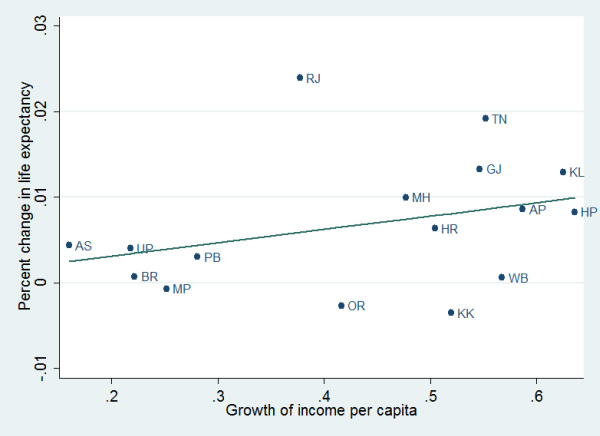 Data for 1990 and 2004 are, respectively, from SRS Based Abridged Life Tables 1988-1992 and 2002-2006.
 Figure 7. Growth and changes in inequality, 1993-2004
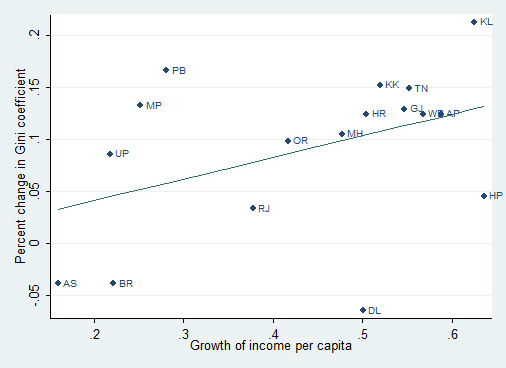 Source: Bhandari and Debroy (2007) Table 2.
 The line in the Figures depicts the average relationship between income and the social outcome (the flatter the line the less strong the impact of income on the social outcome). These figures do not prove that development caused the social outcome, but the associations are nonetheless informative.
Social outcomes in the long run
With the exception of inequality, the Figures show clearly that the more developed states have better social outcomes, just as the richer countries do internationally. That is, states that have a higher standard of living on average tend to have lower levels of poverty, higher levels of life expectancy, and lower levels of child malnutrition. The magnitudes are also interesting. A state like Karnataka that is about 125% richer than Uttar Pradesh (UP) will have a poverty ratio that is about 13 percentage points lower (Karnataka’s headcount poverty ratio was 24%, UP’s 37%; Figure 1). Similarly, Himachal Pradesh, which is one-and-half times as rich as UP, will be associated with a higher life expectancy of 7 years (67 years versus 60 years for UP; Figure 2).
As in every relationship, there are a number of interesting outliers. For example, Kerala stands out as India’s Scandinavia in having much higher lower levels of poverty and better health outcomes for children and the population as a whole. These achievements are greater than what would typically hold given Kerala’s income level (Kerala is far away from the line in Figures 1, 2, and 3).
Another standout state is Jammu and Kashmir, where poverty levels are among the lowest in India despite J&K being one of the poorest states. Clearly, history, and the early land and educational reforms under Sheikh Abdullah have played a key role in this regard, insulating the most economically vulnerable from the subsequent turmoil.
Surprisingly, Gujarat, which is India’s China in growth terms, has been less than stellar in reducing child malnutrition. In 2005-2006, nearly 45% of Gujarat’s children under five years old were malnourished. In richer states – Kerala, Tamil Nadu, and Punjab – the numbers range between 23 and 30%, significantly better than Gujarat’s. Gujarat should also be doing better in terms of life expectancy given how rich it is (it is below the line in Figure 2).
Arguably the worst performer is Madhya Pradesh (MP), which has the highest level of child malnutrition and lowest life expectancy, a poor performance even allowing for the state’s relatively low income. MP also has the second-highest poverty ratio, surpassed only by Bihar.
In fact, Bihar’s performance on poverty is unusually bad. Had Bihar just been a ‘normal’ poor state, its poverty ratio should have been closer to 40% than the 50% it actually registered. And since the poverty numbers are for 2009-2010, Bihar’s miserable showing is a salutary reminder that this state probably needs another decade of Nitish Kumar-type governance before any kind of victory can be declared. Put differently, Nitish Kumar would need to defer his Prime Ministerial ambitions by a decade if his campaign slogan can convincingly be: ‘I will do for India tomorrow what I did for Bihar yesterday.’
Precocious India
The performance of the states on inequality defies the general pattern of higher incomes being associated with good social outcomes. In fact, just the opposite is true: richer states, on average, are associated with higher levels of inequality of consumption (Figure 4).
To some extent, the relationship within India mirrors the experience internationally. But there are also India-specific factors at work, namely the country’s unusual pattern of development. Not just in services but also in manufacturing, India tends to use scarce skill-intensive labour rather than abundant unskilled labour, which in turn skews the benefits of growth towards the few rather than the many. This has created what economists call the ‘Precocious India’ phenomenon whereby India’s pattern of economic specialisation mimics that of countries that are much richer. A more unequal India may not have been so much the consequence of higher growth but rather the collateral damage of a Precocious India.
It follows from this idea of Precocious India that the poorer and more agriculturally-dependent states such as MP and Bihar actually have much lower levels of inequality, indeed lower even than what should be expected given how poor they are (MP and Bihar are below the line in Figure 4). Surprisingly, Kerala is most un-Scandinavian in having very high inequality and much greater than for the typical state (Figure 4).
Social outcomes in the medium run
Not surprisingly, the medium-term relationships between growth and changes in the various social outcomes (Figures 1-4) are less strong than the corresponding long-run relationships (Figures 5-7). That is just a feature of economic data: it is easier to account for long term patterns than short term ones.
That said, however, the pattern of the long run relationships seems to be replicated over the reform period: broadly, across the Indian states, higher growth over the reform period is associated with better social outcomes.
Consider poverty and life expectancy. States that grew faster during the reform period experienced larger reductions in poverty (Figure 5). This association is strong, and excluding either Delhi or Jammu and Kashmir, which are outliers, makes the poverty reduction-growth relationship even stronger. Thus, Andhra Pradesh (AP), which grew at 5.8% per capita between the early 1990s and late 2000s, reduced poverty by a staggering 24 percentage points. In contrast, Uttar Pradesh grew at 2.7% per capita and reduced poverty by only 11 percentage points. But the most striking exception is actually Himachal Pradesh, which reduced poverty by 25 percentage points even though its growth was not a high as AP, Tamil Nadu or Kerala.
The association between growth and changes in life expectancy is weak but positive (Figure 6). The Figure shows that if one excludes a few outliers such as Karnataka and Orissa, there are clearly two groups. The first group comprises Uttar Pradesh, Bihar and Madhya Pradesh which grew more slowly and posted smaller improvements in life expectancy. The second group comprises the traditional fast-growing peninsular states (Tamil Nadu, Kerala, Gujarat, etc.) that grew faster and witnessed bigger improvements in life expectancy. Rajasthan is one of the unsung miracle performers on health achievements, registering over a 15-year period, the biggest absolute (nearly 6 years) and proportionate (10%) gains in life expectancy.
An important point to note is that assessments of changes should take account of the convergence effect. For example, it is more difficult for states that start off healthier to make the same improvements as states whose residents are less healthy. For that reason, the achievement of the peninsular states is particularly impressive. Although they had less room for improvement, they still made greater progress than the others.
On inequality, the pattern over the short run corresponds to the longer-run pattern (Figure 7). Faster growing states tended to become more unequal. Kerala stands out for being most un-Scandinavian: not only did inequality rise sharply during the reform period (the Gini coefficient for consumption inequality increased by 8 percentage points) but did so even more than it should have, reflected in how far Kerala is off the line. And yet again, Himachal Pradesh over-performs: despite growing rapidly, it posts a very small increase in inequality.
Policy conclusions
Thus, it seems clear that within India social achievement is positively associated with growth, both over shorter and longer horizons. The policy conclusion is that a government that pursues growth is and should be less vulnerable to the charge that it is neglecting social objectives. This conclusion is re-enforced if the alternative of pursuing social objectives directly via additional government spending can have the extra costs of leading to ‘leakage’ (as the experience with subsidies and the rural employment guarantee scheme shows) and of compromising the growth objective by aggravating macro-economic risks.
Beyond the policy implications, across-state (and regions) comparisons show that India is endlessly fascinating as a crucible of experimentation and learning about policy, both when it produces general patterns and especially when it throws up exceptions and anomalies.
Supposedly reform-resistant Kerala has been one of the most dynamic states. The very same Kerala, touted as a Scandinavian arcadia, is also the most unequal state and has experienced the greatest increase in inequality since 1991. Rajasthan, the archetypal BIMARU state made the greatest strides in addressing bimari. And least noticed of all, over the reform period, large, urbanised, coastal, and trade-oriented states such as Tamil Nadu, Maharashtra, and Gujarat have been out-performed – against a broad metric that combines income and social outcomes – by tiny and overwhelmingly rural, landlocked and hill-hobbled, Himachal Pradesh.
For a more technical version of this column, see Kathuria and Subramanian (2012). This article first appeared in Business Standard. It has been edited and reprinted with permission from the Author.
Further Reading
- Kathuria, Kamna and Arvind Subramanian (2012), “Income, Growth and Social Outcomes in India: Technical Note”, Centre for Global Development.
- Bhandari and Debroy (2007) "Exclusive Growth - Inclusive Inequality." FISME Policy Paper. Federation of Indian Micro and Small & Medium Enterprises (FISME).

Comments will be held for moderation. Your contact information will not be made public.