

 12 July, 2019


A decade ago, India joined a range of countries that mandate free, compulsory education for school-aged children. Passed in August 2009, India’s Right to Education Act was potentially transformative legislation, yet detailed analysis of its impact on the country’s educational outcomes has been slow to emerge. This article uses three national datasets to consider whether the Act is associated with changes in student enrolment, test scores, pupil-teacher ratios, school infrastructure, and other indicators of educational health and standing.
Many countries across the globe are mandating free and compulsory education for all school-aged children in an attempt to increase access to education. The Indian parliament enacted the Right of Children to Free and Compulsory Education Act, or Right to Education Act (RTE), in August 2009, joining some 20 other countries including Afghanistan, China, and Switzerland, which have laws guaranteeing free and compulsory education for eight years of elementary school (The Hindu, 2010).
The four most important provisions of India’s RTE law are: (i) government schools must be completely free for all children aged 6-14, (ii) no student can be expelled or held back before the completion of primary school (grade 8), (iii) 25% of private school seats must be held for disadvantaged students in the local area, and (iv) infrastructure and minimum quality standards (such as the provision of libraries and girls’ toilets), minimum teacher qualifications, and pupil-teacher ratios (PTR) must be implemented.
Because these laws are generally applied nationally and at a fixed time, it has been difficult to look at their causal impact, and little microeconomic analysis exists. In recent research, Bryce Steinberg and I ask what changes, if any, occurred in the Indian educational system after the passage of this potentially transformative law (Shah and Steinberg 2019). We examine changes in student enrolment and test scores, as well as various school characteristics, such as PTR and school infrastructure. Though we draw on three separate nationally representative Indian datasets (National Sample Survey (NSS), District Information System for Education (DISE), and Annual Status of Education Report (ASER)) to corroborate our findings, we note that the results are associated with the passage of RTE in 2009 and should not be interpreted as causal.
Based on national data, the main findings from this research are:
- School-going increased after the passage of RTE, though this increase is more pronounced in the “primary activity" NSS data than in official enrolment statistics (see Figure 1, panels a-c, below). In addition, we find that larger increases in enrolment are coming from older children (ages 13-16) and from places that had lower enrolment in 2008 (the year prior to RTE).
- Test scores declined after 2010 in both math and reading according to the ASER data (see Figure 2, panels a-b). This is true for students who are currently enrolled and for those who have dropped out. In addition, we observed this decline in both government and private schools, though the decline looks slightly larger in government schools.
- School infrastructure, including PTR, appear to be improving both before and after RTE, so this does not seem to be a school-infrastructure or supply-of-teachers story. In fact, it looks as though teachers are becoming more educated post-RTE, though teacher absenteeism does increase slightly.
- The number of students who had to repeat a grade fell precipitously after RTE was enacted, in line with official provisions of the law.
Figure 1. RTE and enrolment: A snapshot from three datasets
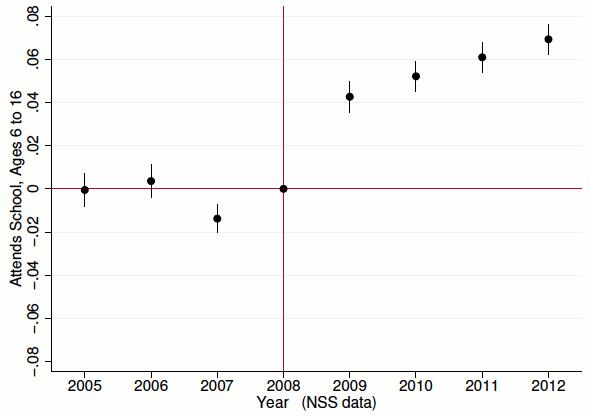
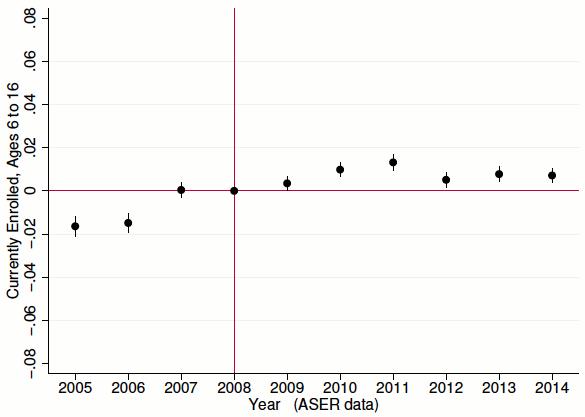
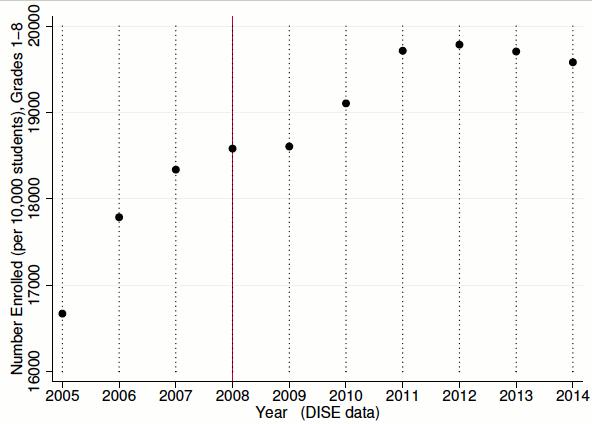
Notes: The top two figures show βt, a vector of coefficients for each year from an OLS (ordinary least squares) regression analysis where dependent variables1are two measures of enrolment (NSS and ASER) and the bottom figure is raw enrolment numbers (District Information System for Education (DISE)). “Attends school” is equal to one if the child lists attending school as his or her primary activity, and zero if she lists another primary activity. “Currently enrolled” is equal to one if the child reports being enrolled in school, and zero if he reports having dropped out or never enrolled. “Number enrolled” is the average of the total number of students enrolled. NSS and ASER regressions contain district, age, and sex fixed effects2and are clustered at the district level. Additionally, 2008 is the omitted base year. Ninety-five percent confidence intervals3are shown for ASER and NSS regressions.
Source: ASER 2005-2014; NSS Rounds 62, 64, 66, and 68 (2005-2012); DISE 2005–2014.
Figure 2. RTE and test scores of the currently enrolled
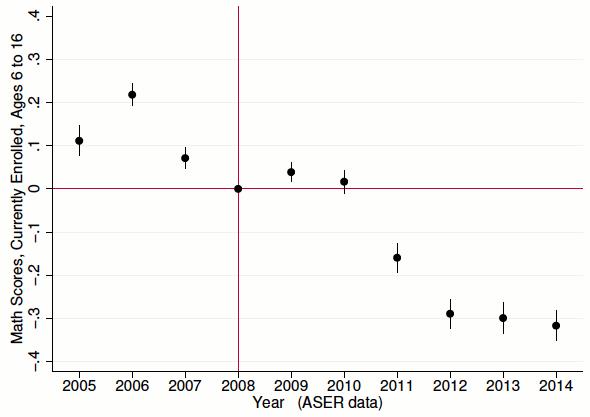
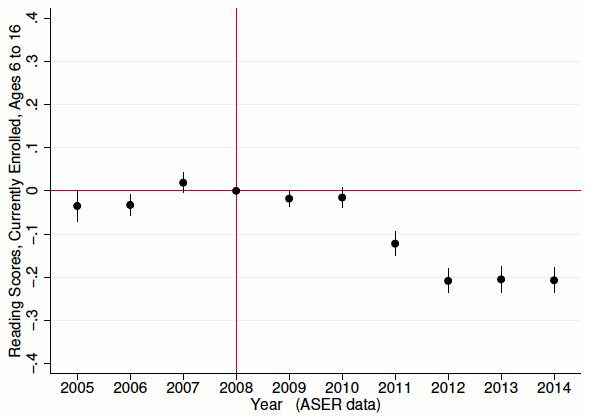
Notes: This figure shows βt a vector of coefficients for each year from an OLS regression analysis where dependent variables are math and reading test scores, with their respective 95% confidence intervals. Math and reading scores range from 0-4. Additionally, 2008 is the omitted base year. All regressions contain district, age, and sex fixed effects and are clustered at the district level.
Source: ASER 2005-2014.
The results are puzzling. The ostensible explanation for the decline in test scores would be overcrowding: more students increase classroom size and this decreases learning. However, the PTR decreased during this period, and to the extent that we can measure infrastructure and resources per student, things seem to be getting better, not worse.
It is possible that RTE changed the composition of students in government and private schools, which could have prompted changes in teaching style by teacher, negative peer effects due to changing student ability, etc.
Another aspect of RTE that could be lowering test scores is the lack of testing and the universal promotion of students in primary school. The overall number of repeaters decreased significantly during this period due to the law. This could have pushed students into upper-level courses for which they were not prepared, exacerbating the problem of instructional mismatch in Indian classrooms (Muralidharan et al. 2019, Duflo et al. 2011, Bau 2017). It is also possible that the lack of high-stakes testing itself decreases learning incentives for both teachers and students (Banerjee and Duflo 2015).
These potential explanations are neither exhaustive nor mutually exclusive. Whatever the reason, it is clear that test scores have declined in India since 2011, two years after the passage of RTE. Hopefully, future research will examine the causes of this decline and how much of it can be attributed to RTE.
This article first appeared on VoxEU: https://voxeu.org/article/india-s-right-education-act
Notes:
- Dependent variable is the variable which is explained in a regression model whose value depends on the values of one or more other variables, called the independent or explanatory variables.
- Variables that are constant across individuals, like sex or ethnicity, and do not change or change at a constant rate over time.
- A 95% confidence interval is a way of expressing uncertainty about estimated effects. Specifically, it means that if you were to repeat the experiment over and over with new samples, 95% of the time the calculated confidence interval would contain the true effect.
Further Reading
- Banerjee, A and E Duflo (2015), ‘Learning’s Not about Enrolment, Latrines in School. We’re Failing Children on Massive Scale’, The Indian Express, 1 February 2015.
- Bau, N (2017), ‘School Competition and Product Differentiation’, Working Paper. Available here.
- Duflo, Esther, Pascaline Dupas and Michael Kremer (2011), “Peer Effects, Teacher Incentives, and the Impact of Tracking: Evidence from a Randomized Evaluation in Kenya”, American Economic Review, 101(5): 1739-74.
- Muralidharan, Karthik, Abhijeet Singh and Alejandro J Ganimian (2019), “Disrupting Education? Experimental Evidence on Technology-Aided Instruction in India”, American Economic Review, 109(4): 1426-60.
- Shah, Manisha and Bryce Millett Steinberg (2019), “The Right to Education Act: Trends in Enrollment, Test Scores, and School Quality”, American Economic Association Papers and Proceedings, 109: 232–238.
- The Hindu (2010), ‘India Joins List of 135 Countries in Making Education a Right’, 2 April 2010.

Comments will be held for moderation. Your contact information will not be made public.