

 14 September, 2018


The crisis that emerged in the US subprime mortgage market this month 10 years ago, not only engulfed the country’s financial system but the entire global economy. In this post, Vikas Dimble and Nalini Gulati explore some of the key effects of the crisis on the Indian economy.
At the turn of the century, with real estate booming, US banks began giving home loans to people who could not afford them. Investment banks bought these loans (along with the good ones), bundled them into complex securities, and sold them to investors. Insurance companies sold cover to investors for these mortgage-backed securities. In 2007, adjustable interest rates on these ‘subprime’ loans began rising; defaults started, and a large number of houses went to banks. Property prices crashed, and the most severe financial crisis in living memory hit the global economy in 2008.1
Limited direct transmission to Indian banking sector
The immediate, direct impact on India’s banking sector was muted given stringent regulation and
According to economist Kaushik Basu, along with precautionary norms of the Reserve Bank of India (RBI), the pervasive use of ‘black money’ in the economy created a bulwark against a crisis in the banking sector. The basic argument is as follows. To avoid taxes, a large part of the payment in almost all property purchases in India is made in cash. This makes the declared value of property lower than the actual value. Mortgage loans can only be raised on the declared value, and the proportion is, in any case, much lower than that in advanced economies like
Real impacts
The real economy, on the other hand, was indeed connected
Figure 1. Growth in external commercial borrowing, 2005–2017 (y-o-y , in %)
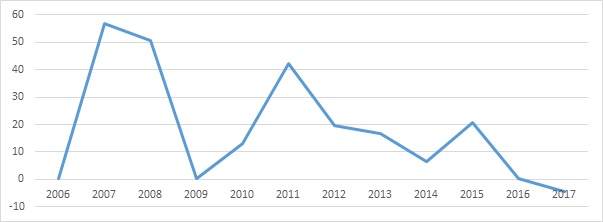 Source: RBI data.
 Figure 2. Growth in total trade (non-oil), 2004-05–2017-18 (y-o-y , in %)
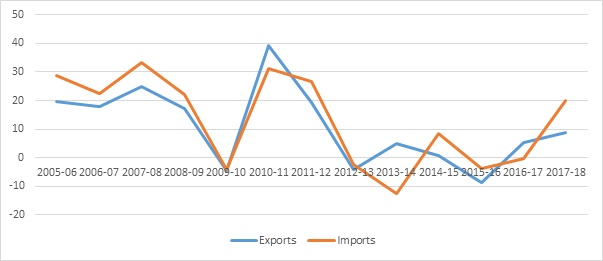 Source: RBI data.
 Infusion of foreign capital
To stimulate aggregate demand and revive growth,
Figure 3. Foreign Institutional Investment (FII), 2005-06–2017-18 (in Rs. crore)
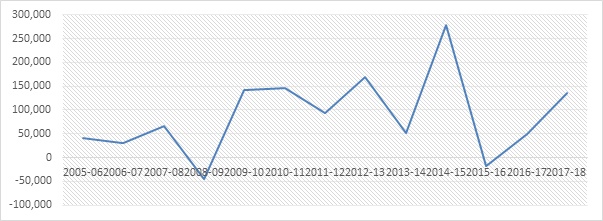 Source: RBI data.
 The sharp increase in FIIs in the years following the crisis largely drove the strong performance of the stock market, which has gone up in value by nearly 90% in the past decade. Immediately after the crisis and before the upturn began, the stock market did crash; however, there is low participation in equity investment among Indian households and hence, the stock market does not have any significant wealth and consumption effects.
Figure 4. Stock market index, 2006–2018
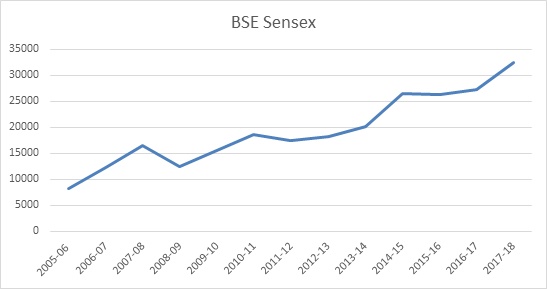 Source: RBI data.
 Note: BSE is Bombay Stock Exchange.
Robust economic growth
Strong GDP (gross domestic product) growth was maintained in India throughout this period. In the pre-crisis year, India was growing faster than the groups of EMEs and advanced economies (Figure 5). Post-crisis, growth fell most sharply in India – from 9.8% in 2007 to 3.9% in 2008. In advanced economies, which were the most affected, the rate fell from 2.7% to 0.1%; the corresponding fall in other EMEs was 8.5% to 5.7%. In 2009, while growth in India jumped up to 8.5%, it continued to fall in advanced economies (to -3.4%), and other EMEs (to 2.8%).
Figure 5. Real GDP growth, 2005–2017 (annual; in %)
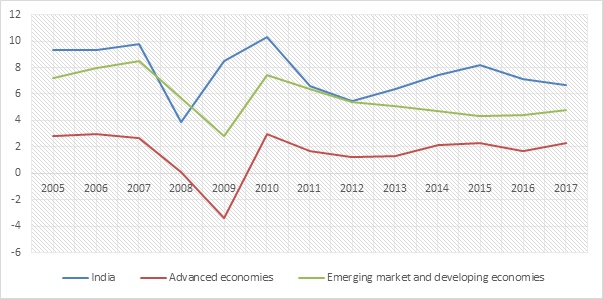 Source: IMF (International Monetary Fund) data.
 Policy responses
In line with efforts made by governments and central banks all over the world, the Indian government and RBI took active steps to counter the slowdown, significantly relaxing monetary policy (interest rate reduction) and introducing fiscal stimulus to boost domestic demand. While the round of stimulus helped spur economic growth, they led to an increase in fiscal deficit. The Fiscal Responsibility and Budget Management (FRBM) Act, 2003 mandates a fiscal deficit of up to 3%. The pre-crisis level was 2.54%, which increased to 5.99% in 2008-09 and 6.46% in 2009-10. While it has more or less shown a declining trend since then, it is still above the FRBM target. Another negative effect of these macroeconomic policies was the increase in inflation from 6.2 (average consumer price index (CPI)) pre-crisis, to 9.1 in 2008-09 and 13 in 2009-10 (Planning Commission, 2014).
Figure 6. Fiscal deficit, 2005-06–2017-18 (% of GDP)
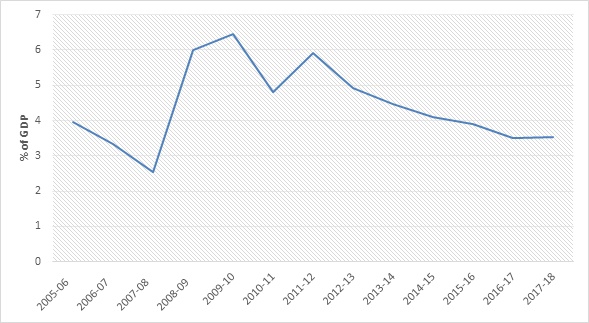 Source: RBI data
 Looking ahead
It is widely believed that India’s stringent regulation and prudent policies enabled it to survive the crisis in reasonably good shape. Economist Ila Patnaik has recently contended that the Indian solution has been to treat the lesson from the crisis as going even more slowly on financial sector liberalisation that it had in the past. However, to serve the growing
The Indian economy is more connected to the global financial system today than it was a decade ago. The exposure to FIIs has increased; these tend to be volatile, making the economy more vulnerable to any external shocks. With interest rates beginning to rise in advanced countries, India may experience outflows of foreign capital. On a related note, since FIIs have been driving the stock market performance, there is concern that the market’s buoyancy is not backed by the real economy.
Further, in the years leading to the crisis, non-performing assets (NPAs) of banks in India were on the decline, putting banks in a strong position to deal with the adverse effects of the crisis. During 2005-2008, annual gross NPAs amounted to Rs. 500 billion, on average; the figure now is a whopping Rs. 7,903 billion.
Finally, at the time of the crisis, the slowdown in advanced countries led to a fall in export demand in India and other emerging economies. The developed world is now getting back to a steady growth trajectory. However, this may not imply an increase in trade given the present sentiment of protectionism.
The authors are grateful to Dr. Pronab Sen for his guidance and inputs.
Notes:
- For a detailed account of how the crisis began, see Business Standard’s explainer.
- Capital Adequacy Ratio (CAR) is the ratio of a bank’s capital in relation to its risk-weighted assets and current liabilities. The required ratio is decided by central banks/regulators to prevent excessive risk-taking.
- According to a 2017 working paper of the International Monetary Fund (IMF), foreign-owned banks can transmit external shocks and might not always expand access to credit.
- It may be noted here that a large segment of the Indian economy is ‘informal’ and does not access bank money as such.
- It is possible that some of the bad loans in the system at present originated in this period.
Balance of payments is a statement of a country's net financial transactions with other countries. It has two components:current account, and capital account. The former includes the visible balance of trade (net difference between exports and imports of merchandise goods) and invisible trade balance (payments and receipts for services); and the latter measures inflow and outflow of short- and long-term capital. The current account and capital account can be either in surplus or deficit, but inprinciple there should be no surplus or deficit in the overall balance of payments.

Comments will be held for moderation. Your contact information will not be made public.