

 16 November, 2016


Rajeswari Sengupta, Assistant Professor at IGIDR, points out that the methodology used for the new GDP series seems to be underestimating the GDP deflator, which in turn is causing real growth to be overstated, perhaps by as much as 2 percentage points.
This is the second of a four-part series.
According to the Central Statistics Office (CSO), India is positively booming. It is the fastest-growing large economy in the world. Many private economists however hold a different view, arguing that the country is struggling to recover from its post-2010 downturn.
They point out that the GDP (Gross Domestic Product) series seems inconsistent with the high-frequency macroeconomic indicators, such as the stagnating Index of Industrial Production (IIP). Growth purportedly accelerated by a full percentage point in 2013-14, even though that year was marked by a near-crisis. GDP growth accelerated further to more than 7½% in 2015-16, even though exports fell and investment growth nearly vanished – a combination that has no precedent in India’s post-independence economic history.
Such criticisms have created persistent doubts about the official GDP estimates. But there the matter has rested. The debate seems at an impasse. The CSO has not changed its numbers, and the dissenting economists continue to question the official data.
If this discussion is to move forward, what is needed is a dispassionate examination of the CSO’s methodology, to see if there are any possible problems. As it turns out, there does appear to be a problem, and it is a significant one. The CSO seems to be underestimating the GDP deflator, which in turn is causing real growth to be overstated, perhaps by as much as 2 percentage points. As a result, growth may be closer to 5½% than to 7½%.
Problems with the deflator
To get to the heart of the problem, one needs to understand how the GDP figures or almost equivalently, Gross Value Added (GVA) figures are calculated. In the broadest terms, the procedure followed by the CSO is the same as that all over the world. It obtains data on the nominal values of output produced in various sectors of the economy from the financial accounts of firms. Then, it deflates these figures by price indices to arrive at estimates of real GDP. CSO’s methodology differs from what is followed in other countries in two specific areas: the price indices it uses, and the deflating procedure it follows. Both of these deviations from international practice have created problems. I consider each in turn.
In most countries, nominal production is deflated by the producer price index (PPI). India lacks a PPI, so the CSO uses the wholesale price index (WPI) instead. In some ways this makes sense because the WPI is arguably the closest available substitute, as it measures the price of goods at the factory gate. But the WPI suffers from several drawbacks. For one, it does not measure the price of services, and services constitute the bulk — around two-thirds – of India’s economy. Instead, the WPI is heavily weighted towards commodities, especially oil. So when oil prices fall, the WPI falls, and this leads to measured deflation in the services sectors (notably finance and trade) even if service costs are actually rising. As a result, growth in services could be overstated by a large margin. To correct this problem, whenever oil prices (or prices of raw materials in general) fall, the deflator needs to increase in order to keep the real value of the production unchanged.
Single vs. double deflation
The other major problem lies in the way the deflator is calculated in the manufacturing sector. The CSO uses specific components of the WPI to deflate each manufacturing subsector, such as the steel WPI for the steel industry and so on. This is a painstaking procedure, but it can still yield misleading results - a simple example given in Table 1 below shows how.
Consider a case where actual production is stagnating at say 100 units in years 2014-15 and 2015-16 but output and input prices are changing. Assume that a firm raises its output price by 5%, in line with general consumer price index (CPI) inflation, whereas the price of its raw materials falls by 5 percent since WPI is down by 5%. In this example, nominal value added defined as value of sales less value of raw materials will increase by 8% from 2014-15 to 2015-16. Since this increase arises entirely from price changes, it needs to be deflated away in order to obtain ‘real GVA at constant prices’.
The standard international practice, followed by nearly every major country with the exception of China and India, is to use a methodology called ‘double deflation’. Under this procedure, the output price is deflated by an output deflator, while raw material prices are deflated by a raw material deflator. Then the two real numbers are subtracted, to obtain real GVA estimates.
Table 1. GDP derivation: Illustrative example
| 2014-15 | 2015-16 | 2015-16 | 2015-16 | 2015-16 | |
| Values | Nominal | Nominal | Real | Real | Real |
| Estimated using Double Deflation | Estimated using Single Deflation and WPI | Estimated using Single Deflation and CPI | |||
| Sales | 100 | 105 | 100 | ||
| Raw materials | 20 | 19 | 20 | ||
| Value added | 80 | 86 | 80 | 91 | 82 |
| CPI inflation (%) | 5 | ||||
| WPI inflation (%) | -5 | ||||
| Growth (%) | 8 | 0 | 13 | 2 |
As Table 1 shows, using this methodology real GVA growth is zero. In other words production has remained unchanged, which is correct, by construction.
If the CSO’s method of single deflation were applied to this example, one would simply take the nominal value added and deflate it by the WPI. Since nominal growth is 8% and the WPI has fallen by 5%, then real GVA growth is estimated at 13%, which is clearly way off the mark. It conveys the impression of a boom when none in fact exists.
Addressing the problem
To ensure that the GDP numbers accurately reflect developments in the economy, the CSO needs to develop proper PPIs, and then employ them using the double deflation methodology. But such a solution is far away. It will take some time to develop PPIs, and even longer to calibrate double deflation for each sector. There is however an interim solution that can be much more easily applied.
The CSO can start using the CPI series, instead of the WPI. Using the CPI in manufacturing would not solve the problems caused by single deflation as that can only be resolved through the introduction of double deflation methodology, but it would nonetheless help as shown in Table 1. The main reason is that the CPI at least has the correct sign for the deflator. It is increasing when the deflator needs to increase, rather than falling like the WPI. The result, of course, is not perfect. Using the CPI to deflate the nominal value added leads to an estimated real GVA growth of 2%, when the correct answer is zero. But this is much closer to the reality than the 13% real growth rate obtained by using WPI as the deflator.
The better ‘fit’ of the CPI is not just an accident of the particular example chosen. It is perfectly general because when commodity prices (such as oil prices) fall, GVA tends to increase, at least in commodity importers such as India. (In this case, one should think of GVA as firm profits, which will go up when input prices fall.) Since this increase needs to be deflated away to arrive at a real GVA estimate at constant prices, one needs an index that will increase when commodity prices fall, rather than decrease, as the WPI tends to do. The CPI will also tend to decrease, but by much less than the WPI, since commodities constitute a much smaller share of the consumer basket.
As an approximation, it is worthwhile checking what would happen if the manufacturing GVA as calculated by the CSO used the CPI in place of the WPI as a deflator. The official numbers show that in 2015-16, nominal growth was 8%, and real growth 9% in this sector. If the correct deflator was actually around 3%, in line with CPI manufacturing inflation, then real growth was only around 5% - much more in line with the IIP.
The change to CPI makes even more sense in the services sector, because the CPI has extensive information on price movements in the various services subsectors. It would make significant differences to the estimated 2015-16 growth figures in trade/transport/communication and financial services, bringing down their estimated growth rates down by around 5 percentage points in each case.
An old problem?
It is important to understand that most of what has been said above is not new. The problems of using WPI to deflate services, as well as of single deflation have existed for a long time. It is just that the distortions they create have come to the fore with the new GDP series. This is because, around the time of release of the series, the CPI-WPI differential in India widened out to historically high levels (Figure 1).
Put another way, the CPI-WPI differential gives an indication of the degree to which the real GDP numbers might be distorted. The differential is not a one-to-one measure of the distortion, nor would the distortion disappear, even if the differential goes to zero. But the differential does give a rough and ready measure of the extent to which there is a problem in the GDP data.
Figure 1 shows that this is not the first time that real GDP growth may have been overestimated, nor is this the period when the overestimate may have been the highest. In fact the ‘overestimate’ was highest in 2009-10 when the collapse of international commodity prices pushed the deflator far below the CPI, suggesting that much of the measured rebound that year may have been illusory. In contrast, growth may well have been underestimated in 2004-05.
Figure 1. Co-movement of GDP deflator and CPI series
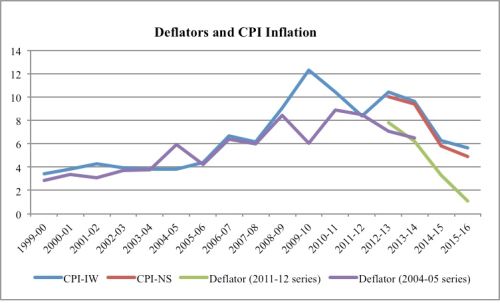 Source: Economic Outlook database of the Centre for Monitoring Indian Economy (CMIE).
 Conclusion
Summing up, there appear to be recurrent problems in estimating the GDP deflator in India. Never have these problems prolonged as much as in the past few years. They have persisted since 2012-13, most likely leading to a significant overestimation of GDP growth rates. It will not be easy to solve the problems but some intermediate steps can be taken. Given that GDP data is fundamental to all policy analysis and policymaking, it is important to make these improvements soon.
In the next part of the series, Amey Sapre, doctoral student in Economics at IIT Kanpur, discusses some areas of concern around growth overestimation in Indian manufacturing sector.

Comments will be held for moderation. Your contact information will not be made public.