

 31 January, 2022


Government of India appoints three external members on the six-member Monetary Policy Committee, and the statements of all MPC members are released after every committee meeting. Based on data from 30 MPC meetings conducted between October 2016 and August 2021, this article shows that the statement tone and other communication characteristics have differed between external and internal members, with change of RBI governor seemingly having a greater influence on the statements of external members.
In 2016, in a move agreed on with Government of India, the Reserve Bank of India (RBI), moved to flexible inflation targeting. The Monetary Policy Committee (MPC) of the RBI is responsible for achieving the target CPI (consumer price index) inflation of 4% within a range of 2% higher or lower than this value, and each MPC has a tenure of four years.
Unlike the Federal Open Market Committee of the United States, which consists of only internal members (IMs), Government of India appoints three external members (EMs) on the six-member MPC, similar to the Bank of England’s MPC that comprises IMs and Chancellor-appointed EMs. The statement of each member of the MPC is released in the public domain around two weeks after every committee meeting. The composition of the RBI’s MPC provides a unique case to examine the impact of the heterogeneity in communication from the two groups of MPC members. Heterogeneity in economic information, its differential interpretation about the economic impact, and a variation in weights placed on growth and inflation are reflected in the members’ statements, potentially having a distinct impact on market variables and public opinion.
In recent research (Mahambare and Pathak 2021), based on data from 30 MPC meetings held between October 2016 and August 2021, we examine the tone, complexity, and topic of the statements of EMs and IMs, and bring out the similarities and differences between them. Using recent innovations in text analysis, we extend the existing literature both in general and specifically for India (Mathur and Sengupta 2019, Anand et al.2021a, RBI, 20211) to more accurately measure the tone of the statements, and to analyse the IMs’ and EMs’ statements separately.
Using text analysis to examine MPC members’ statements
We use a ‘sentence’ as the unit of analysis instead of words, and include valence shifters, that is, words which change or enhance the meaning of the sentence, as developed by Anand et al. (2021b). This results in the improvement in tone quantification as explained by the following example.
“…thus, inflation rising above the target of 4 percent does not seem to be any concern for the policy right now.” – Mridul Sagar (MPC member), 5 April 2021.
The traditional ‘bag-of-words’ approach, which analyses ‘one word at a time’, and LM (Loughran McDonald) dictionary2, would assign a negative tone to the above sentence, since it does not account for “not …any… concern”, and calculates the negative tone due to the word3 ‘concern’ only(= - 0.11). With the methodology we employ (with a sentence considered as a unit), we find that the tone becomes positive (= +0.10), since our methodology considers the quantification of negator “not” along with the negative polar word “concern”, which makes the overall tone of the sentence positive.
Internal versus external MPC members’ communication tone
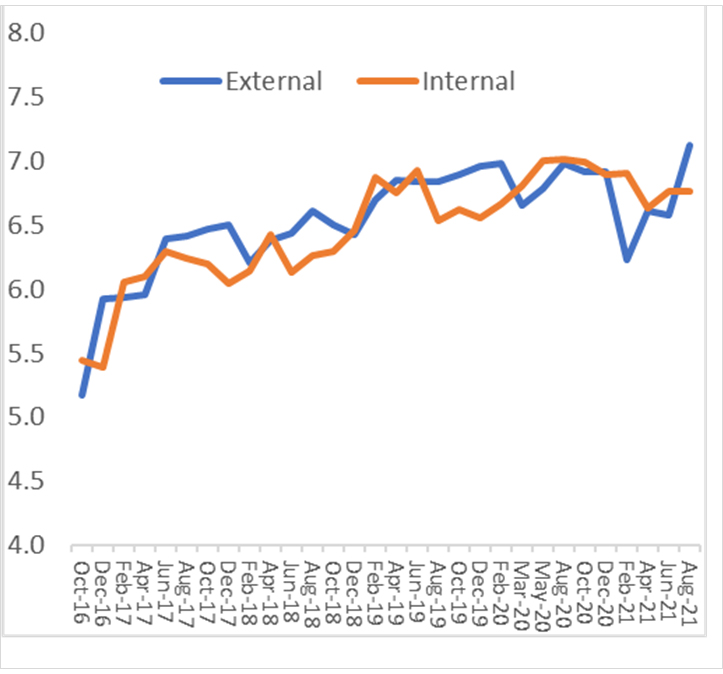
In terms of readability, we find that there is no upward trend in the words-per-sentence in the member statements of MPC over time (Figure 1). However, both IMs’ and EMs’ statements have become lengthier over time, in terms of the number of sentences (Figure 2), with an increase in the proportion of complex words in IMs’ statements, which tends to lower the readability of the statements and make them more difficult to understand and analyse.
Figure 1. Average number of words per sentence
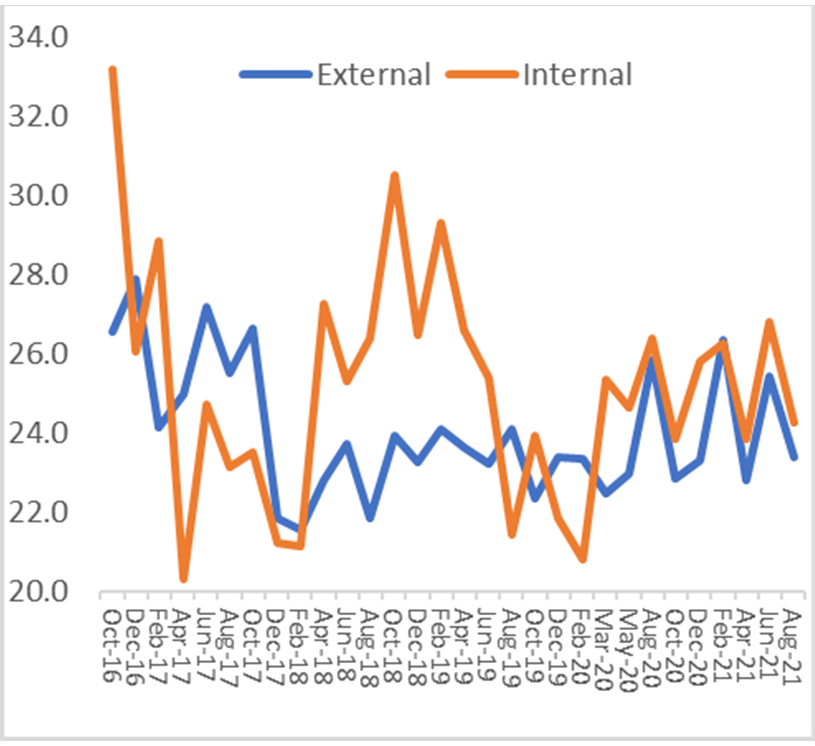
Figure 2. Log of total words per statement
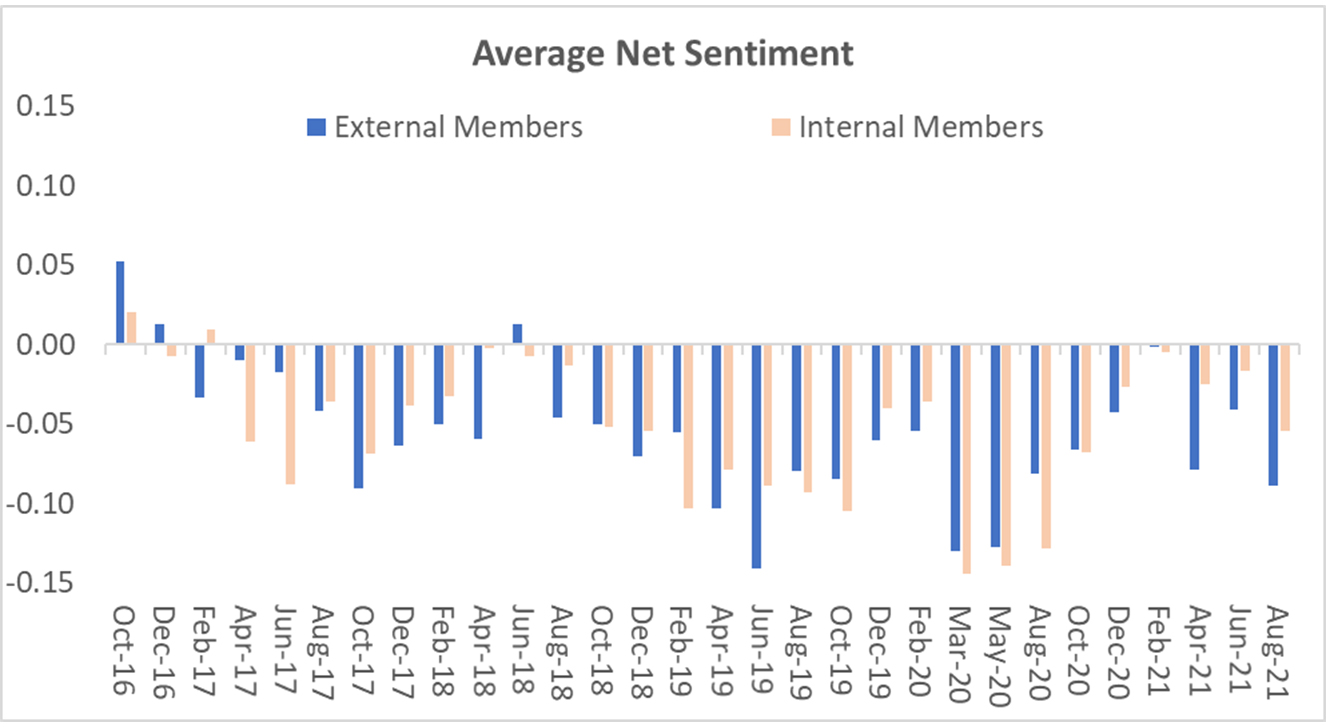
With respect to tone, the average tone in MPC statements is ‘positive’ for only one out of 30 meetings. The tone started worsening in October 2018, reflecting the slowdown in the Indian economy due to the impact of demonetisation. The tone became increasingly negative again in March 2020 (with the onset of the pandemic) but has gradually improved since then. There are differences in the tone pattern of the IMs and EMs’ statements (Figure 3). First, the lowest negative tone was recorded during the pre-pandemic period for EMs in June 2019 and for IMs in March 2020. Second, the worsening, as well as the subsequent recovery of tone, has been faster for IMs. This is observed both in early 2017, following the announcement of demonetisation, and during the pandemic period from March 2020, and suggests variation in the interpretation of the economy, and/or differential weight placed on growth and inflation by EMs and IMs.
Figure 3. Average net sentiment
Topics analysed in statements
RBI (2021) notes that the frequency of words related to ‘growth’ was higher in the MPC statements during 2019, when the repo rate was being lowered or in other words during the ‘accommodative’ phase of 2019, while that of the ‘inflation’ words was higher during the earlier tightening stance. Our analysis using the Latent Dirichlet Allocation (LDA) while broadly in line with the above observation, finds that the emphasis placed on inflation and growth in the IMs’ statements from one meeting to the another is more volatile compared to relatively stable weights in the EMs’ statements (Figures 4 and 5). Up until the middle of 2017, EMs’ statements appear to place a higher weight on inflation while in the later period, the emphasis on inflation in IMs’ statements rose considerably, while remaining volatile. Since the beginning of the pandemic, the statements of both groups overwhelmingly weigh on the growth concerns.
Figure 4. IMs’ statements, by topic

Figure 5. EMs’ statements, by topic
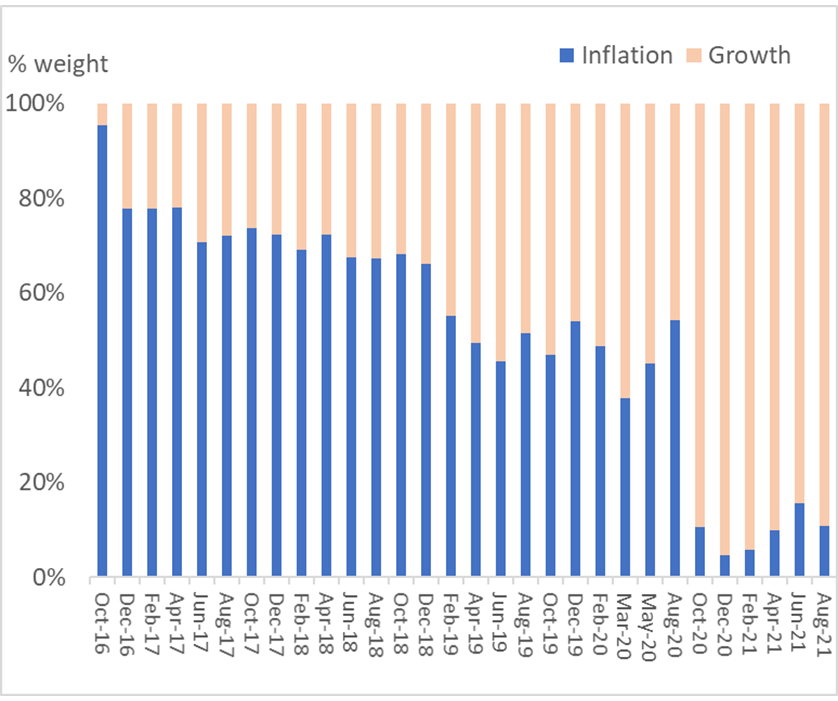
Table 1 reports the tone, inflation weight, and growth weight averages and correlation between the communication tone between EMs’ and IMs’ statements for the entire period, for sub-samples for the pre-pandemic and the pandemic period, along with the weights placed by the two groups on ‘growth’ and ‘inflation’. Table 2 reports the same for the tenures of two RBI’s governors over this time period. We find that both IMs’ and EMs’ average weight on growth remains stable while the weight on inflation varies sharply depending on the changing macroeconomic conditions. For EMs the average weight on inflation is only marginally higher (0.52 for inflation versus 0.47 for growth) while it was substantially higher for IMs (0.59 for inflation versus 0.40 for growth) for the full sample period.
Table 1. Differences between the statements of EMs and IMs and correlations- Full sample, and the pre and post 2020
|
|
Tone |
Inflation weight |
Growth weight |
|
Full sample (October 2016 to August 2021) |
|||
|
Averages |
|||
|
IMs |
-0.052 |
0.59 |
0.4 |
|
EMs |
-0.056 |
0.52 |
0.47 |
|
p-value |
0.75 |
0.33 |
0.33 |
|
Correlation |
0.71 |
0.74 |
0.74 |
|
p-value |
0.0001 |
0.0001 |
0.00001 |
|
October 2016 to December 2019 |
|||
|
Averages |
|||
|
IMs |
-0.057 |
0.7 |
0.4 |
|
EMs |
-0.057 |
0.63 |
0.47 |
|
p-value |
0.96 |
0.07 |
0.07 |
|
Correlation |
0.73 |
-0.02 |
-0.02 |
|
p-value |
0.00001 |
0.91 |
0.91 |
|
February 2020 to August 2021 |
|||
|
Averages |
|||
|
IMs |
-0.032 |
0.14 |
0.4 |
|
EMs |
-0.053 |
0.15 |
0.47 |
|
p-value |
0.23 |
0.85 |
0.85 |
|
Correlation |
0.72 |
0.6 |
0.6 |
|
p-value |
0.1 |
0.14 |
0.14 |
Notes: (i) p-value is the probability of getting results at least as extreme as the results observed, given the assumption that the null hypothesis is true. A p-value lower than a mentioned significance level would be considered statistically significant (if p < 0.01, it is statistically significant at the 1% level). (ii) The statistical significance may not be accurate given the small number of sub-sample observations. (iii) The weights for inflation and growth for each date, for each group (EMs and IMs), adds up to 1, given the way LDA is performed by examining the weight of each topic given by each group of members for each statement. (iv) The average values in the sub-samples (such as post- or pre-2020), however, do not add up to one since these are averages for the time period and may be impacted by the extreme values. For example, while the average values for weights of two topics for IMs and EMs add up in the full sample, the same is not true in pre- and post-2020 since the maximum and minimum have changed during these subsamples.
Table 3: Differences between the statements of EMs and IMs and correlations by the RBI governor tenure
|
|
Tone |
Inflation weight |
Growth weight |
|
Governor Urjit Patel (October 2016-December 2018) |
|||
|
Averages |
|||
|
IMs |
-0.03 |
0.71 |
0.4 |
|
EMs |
0.032 |
0.73 |
0.47 |
|
p-value |
0.89 |
0.55 |
0.55 |
|
Correlation |
0.48 |
-0.46 |
-0.46 |
|
p-value |
0.08 |
0.1 |
0.1 |
|
Governor Shaktikanta Das (February 2019-August 2021) |
|||
|
Averages |
|||
|
IMs |
-0.071 |
0.49 |
0.4 |
|
EMs |
-0.077 |
0.35 |
0.47 |
|
p-value |
0.72 |
0.15 |
0.15 |
|
Correlation |
0.73 |
0.85 |
0.84 |
|
p-value |
0.001 |
0.00001 |
0.0001 |
IMs’ higher emphasis on inflation in the full sample period is due to a much higher weight placed on inflation during the pre-2020 (pre-Covid-19) period (0.70) compared to the weight placed on it by EMs (0.63) (Table 2). At the onset of the pandemic, both IMs and EMs’ statements heavily reflected the growth concerns with the weight on inflation dropping dramatically. We also divide the sample period into the meetings when Governor Urjit Patel was at the helm of the RBI till the meeting of December 2018 and the rest of the period till the present, since Governor Shaktikanta Das took over (Table 3). During Governor Patel’s tenure, the average weight on inflation was the higher for both IMs (0.71) and EMs’ (0.73) compared to the average weight on growth (0.40 and 0.47, respectively).
With the start of Governor Das’ tenure since the beginning of 2019 (Figure 5), both IMs’ and EMs’ average weight on inflation began to decline with EMs’ weight averaging at 0.35, and IMs' at 0.49. More importantly, the correlation between the IMs’ and EMs’ weight on inflation became positive and significant, compared to the negative correlation in the earlier period, suggesting a convergence of views between the two groups of members. The overall net sentiment in the EMs’ statements also began to deteriorate quickly after the end of Governor Patel’s (Figure 3) tenure and reached the lowest point in the statements of June 2019. In contrast, there was a less discernible variation in the weight on inflation in the IMs’ and it remained at a higher level throughout 2019 until the start of the Covid-19 pandemic. The lower readability of the IMs statements, as reflected in a higher share of complex words, could also be a result of their greater weight on the topic of inflation, the nuances of which may be harder to communicate.
The faster deterioration in the EMs statement tone and a higher average weight placed on growth since the start of 2019 is likely to be reflective of greater concern of the EMs on slowdown in consumption expenditure and deteriorating external trade performance in the 2018-19 advance estimates of India’s GDP (gross domestic product) released in January 2019 (Ministry of Statistics and Programme Implementation, 2019), along with investment demand showing signs of weakening. Reflecting the growth slowdown, the MPC, in its February 2019 meeting, also revised down the expected CPI inflation to 3.2%-3.4% for the first half of 2019-20, well below its upper threshold of the CPI inflation target of 6%. Subsequently, as the growth momentum worsened, starting with the first meeting of Shaktikanta Das as the RBI governor, the MPC voted for five consecutive repo rate3 cuts by the MPC from February to October 2019.
Conclusion
We examine the differences in the tone of the statements of IMs and EMs of India’s MPC using recent innovations in text analysis. We find that the statement tone and other communication has differed between the groups of government-appointed EMs and the RBI’s IMs of the MPC between the tenures of the RBI governors – with the change of governor seemingly having a greater influence on the EMs’ statements. Our findings of the differences in IMs’ and EMs’ statement tone and the variation in the emphasis on growth versus inflation are also significant in the context of the Indian government’s earlier stance in 2015. This was laid out in the revised draft of the Indian Financial Code, where the government had proposed that it would have the right to appoint four members in the seven-member MPC. This was later reversed to the appointment of three EMs in a six-member MPC.
Notes:
- To the best of our knowledge, up till now, there has been no empirical work about the differences in communication tones conveyed through the statements of different groups of MPC members.
- The LM dictionary is used to determine which tokens (collections of characters) are classified as words, and also includes sentiment word classifications.
- Polar words are defined as words with a clearly defined sentiment.
- Repo rate is the fixed rate at which RBI lends to banks.
Further Reading
- Anand, Abhinav, Sankarshan Basu, Jalaj Pathak and Ashok Thampy (2021a), “The impact of sentiment on emerging stock markets”, International Review of Economics and Finance, 75: 161-177.
- Anand, Abhinav, Sankarshan Basu, Jalaj Pathak and Ashok Thampy (2021b), “Whose speeches impact Euro pean markets: ECB’s or the national central banks?”, European Financial Management, Forthcoming.
- Apel, M and MBGrimaldi (2012), ‘The information content of central bank minutes’, Sveriges Riksbank Working Paper Series 261.
- Apergis, Nicholas and Ioannis Pragidis (2019), “Stock price reactions to wire news from the European Central Bank: Evidence from changes in the sentiment tone and international market indexes”, International Advances in Economic Research, 25(1): 91-112. Available here.
- Hayo, Bernd, Ali M Kutan and Matthias Neuenkirch (2012), “Communication matters: Us monetary policy and commodity price volatility”, Economics Letters, 117(1): 247-249.
- Loughran, Tim and Bill McDonald (2014), “Measuring readability in financial disclosures”, Journal of Finance, 69(4): 1643-1671.
- Mahambare, Vidya and Jalaj Pathak (2021), “Differential Impact of Diversity in Policy Communication”, Economics Letters, 209: 110142.
- Mathur, A and R Sengupta (2019), ‘Analysing monetary policy statements of the Reserve Bank of India’, Graduate Institute of International and Development Studies Working Paper, No. 08-2019.
- Ministry of Statistics and Program Implementation (2019), ‘First Advance Estimates of 2018-19’, PIB Press Release, 7 January.
- RBI (2021), ‘Monetary policy decision making process’, Report on Currency and Finance.
- Smales, Lee A and Nicholas Apergis (2017) “Understanding the impact of monetary policy announcements: The importance of language and surprises”, Journal of Banking & Finance: 80: 33-50.
- Tillmann, Peter and Andreas Walter (2019), ‘The effect of diverging communication: The case of the ECB and the Bundesbank’, Economics Letters, 176: 68-74.

Comments will be held for moderation. Your contact information will not be made public.