

 01 December, 2020


In the wake of the large-scale return of migrant workers from cities to rural areas on account of the Covid-19 lockdowns and associated job losses, it was apparent that MNREGA would need to play a crucial role. The government responded by expanding the employment guarantee programme substantially during May-July 2020. Narayanan, Oldiges and Saha assess whether the additional MNREGA person-days generated are distributed across districts in ways that are commensurate with their population shares of outmigration and poverty.
Ever since its inception in 2006, the MNREGA (Mahatma Gandhi National Rural Employment Guarantee Act)1 has served as a credible – if flawed – safety net, serving as a lifeline for millions of vulnerable rural people. In the wake of the Covid-19 lockdown2 – that triggered widespread job losses in the cities prompting a large-scale return of migrant workers to rural areas – it was apparent that the MNREGA would need to play a crucial role. Many migrant workers were overwhelmingly from districts that were already poor to start with (Imbert 2020), where finding work would be a challenge. Many therefore called for a “million worksites”, for a rapid expansion of the MNREGA.
After a sharp dip in April 2020 on account of lockdown restrictions, MNREGA expanded substantially between May and July 2020 relative to the eve of the lockdown, before it returned to pre-lockdown levels by August 2020 (Figure 1). For the period spanning the Covid-19 lockdown and after (1 April to 15 September 2020) 58.5 million households and 83.5 million workers had been employed under the MNREGA. As reported, the programme had generated a total of 2.02 billion person-days, compared with 1.88 billion for the entire fiscal year of 2019-20.
Figure 1. MNREGA during Covid-19: Persons demanding work vs. person-days generated
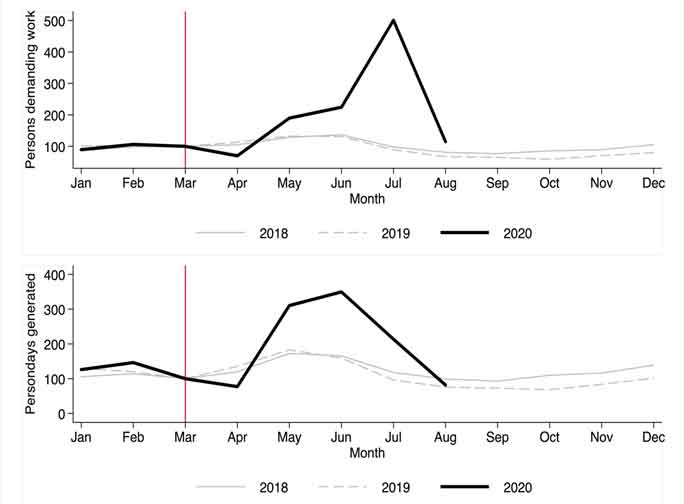
Note: March of each year is set as base=100. The vertical red line denotes the month of the lockdown.
Source: Based on MIS data.
Pro-outmigrant and pro-poor?
Despite the expansion in the months following the lockdown, little is known about whether the programme has expanded sufficiently to meet the surge in demand, especially in districts that account for large shares of outmigrants and the poor. India's employment guarantee was designed to be demand-driven and self-targeting and we examine whether it has fulfilled its promise in areas that need it the most. This is especially important in a context where historically poorer states have utilised less funds than states that are less poor (for example, see Saxena 2016).
Combining monthly administrative data on the MNREGA between 2018 and 2020with district-level data on migration (2011 and 2007-2008) and multidimensional poverty (2015-16),3 we assess whether the additional person-days in public works employment generated are distributed across districts in ways that are commensurate with their population shares of outmigration and poverty. We present our findings below (Narayanan, Oldiges and Saha 2020).
Demand and unmet demand
Between 1 April and 31 August 2020, 8.5 million fresh job cards had been issued countrywide, representing a 22% increase in the number of new job cards compared with the previous year (People's Action for Employment Guarantee, 2020). About 55% of the job cards issued and applied for during 2020-21 have been in the ‘high’ outmigrant districts (that is, top tercile4 by share of all outmigrants in the country). This is a clear sign of demand for work by new households likely on account of migrant returnees. Yet, the job cards issued in the ‘high’ outmigration districts remain less than proportionate relative to their share of outmigrants and/or the poor. The same is true of the top tercile of districts based on poverty share and poverty rate.
We also find that there is substantial unmet demand in the programme in these districts, that is, the proportion of households who sought work but did not get work. In a demand-driven programme where access to work under the MNREGA is an entitlement, in principle, any household that seeks work ought to obtain work. However, given limited resources, districts might be constrained from providing everyone with work and we examine whether such rationing varies systematically across district types. The administrative rationing rate countrywide, for the period May to August was 22.7% in 2020, relative to 15.1% in 2019. We find however that administrative rationing is substantially higher in regions that have higher shares of outmigrants and amongst these districts, rationing is higher in poorer districts (Figure 2).
Figure 2. Unmet demand in high outmigration districts
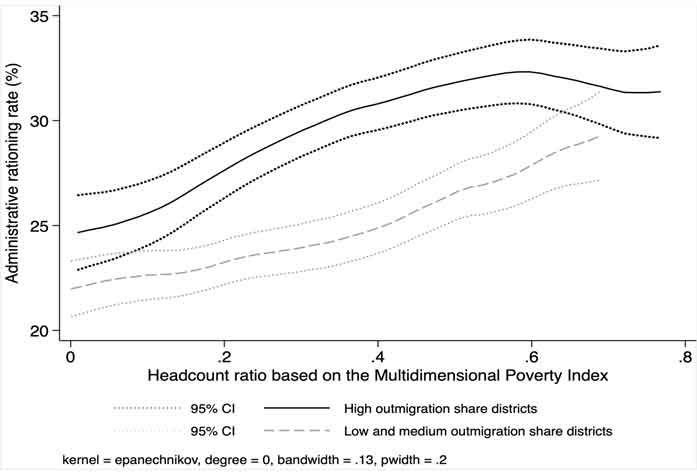
Note: Administrative rationing rate is computed as the percentage of households who demanded work but who did not get work. The figures are ‘local polynomial regression’ with confidence intervals.5 High outmigration share districts refer to those districts that are in the top tercile in terms of the district’s share in all outmigrants.
Source: Data presented here are of monthly rationing rates for May through August 2020.
MNREGA’s expansion
Most districts have been able to generate significantly higher levels of employment relative to previous levels. At the same time, the districts in the top tercile of outmigrant shares have expanded only 1.48 times relative to the same period last year, as compared with the bottom tercile, which has generated 1.73 times the person-days. Although the former districts account for 72.2% of all outmigrants, they account for only 54.8% of the person-days generated during May-August 2020.
We decompose the total person-days generated under the MNREGA during the months of the nationwide lockdown (focusing on May 2020) into two parts: that accounted for by the inclusion of more households under the programme (hence, expansion on the extensive margin), and the other by expanding the number of days each household works (the intensity of participation, hence, expansion on the intensive margin). We plot the intensive and extensive margin of the MNREGA expansion each on a district-level map based on the year on year change of the months, May 2019 and May 2020 (Figure 3). For May 2020, we find that about 55% of the expansion in person-days, relative to May 2019, has come from the extensive margin. We find that poorer districts appear to have extended the programme to include more households (rather than giving more work to already working households), but the same does not seem to be the case for districts with a high proportion of all outmigrants in the country.
Figure 3. Extensive and intensive margins of MNREGA expansion
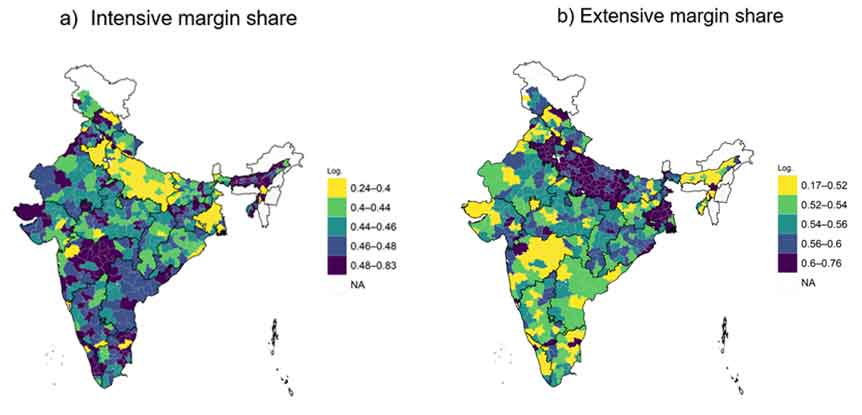
Note: Urban districts in the map are coded as N/A. Bardhaman, Balrampur, and Puducherry are set to 0 due to incomplete data.
Source: Authors' calculations based on MIS data for May 2019 and May 2020, and Census 2011. Excludes districts that do not have a consistent series, district boundaries of 2011.
The decomposition exercise is instructive in understanding the nature of expansion of the MNREGA but is not in itself informative on whether the overall expansion is adequate for the needs. Here we use the average person-days generated per rural household from the 2011 Census data to judge the scale of expansion, following Drèze and Oldiges (2011). In Figure 4, we show the overall coverage across districts in terms of average person-days per rural household in May 2020.
Figure 4. MNREGA Person-days per rural household in May 2020
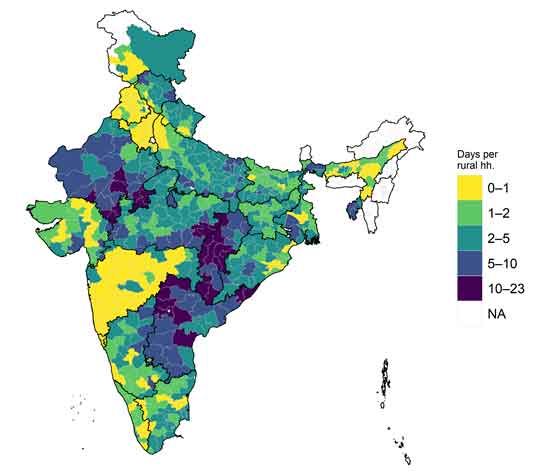
Note: Urban districts in the map are coded as N/A. Bardhaman, Balrampur, and Puducherry are set to 0 due to incomplete data.
Source: Authors' calculations based on MIS data for May 2020 and Census 2011. Excludes districts that do not have a consistent series, district boundaries of 2011.
Districts in states such as Andhra Pradesh, Telangana, Chhattisgarh, and Rajasthan – that have traditionally been implementing the programme well – continue to generate a larger number of days per rural household. For example, as the top-performing state in this regard, Telangana (across all its districts) provided 11.4 days on average per rural household in May 2020, and Chhattisgarh 10.65. In contrast, for states that also saw a high expansion on the extensive margin at the district level (Figure 3b) – Uttar Pradesh, Bihar, and West Bengal – these figures stand at 2.75, 1.98, and 3.10, respectively. We, therefore, notice that despite expanding significantly, many states – that incidentally also account for a large proportion of outmigrants – continue to generate just a few days per rural household. Between May and August 2020, the employment guarantee provided 31 days per working household; yet this is equivalent to just 13.5 days per rural household. Our analyses show that districts that account for a higher outmigration share are not differentially ramping up the programme; instead implementation patterns are consistent with past records of person-days generated or rationing rate.
MNREGA’s relevance going forward
Our findings suggest that the impressive expansion of the MNREGA notwithstanding, the programme needs continued funding and attention to fulfil its promise as a credible safety net, especially in districts that need it the most. Although the Government of India announced additional allocations, which, in nominal terms, are the largest ever since the inception of MNREGA, a substantial portion of these have gone into servicing pending wage and material payments. The allocations also fall well short of what is required for a crisis of this magnitude, with many districts already running out of funds. Several commentators have pointed out a number of other problems that prevent MNREGA from being an effective palliative. Even as there is significant unmet demand, many MNREGA households that do get work are quickly reaching their 100-day minimum entitlement – an estimated 13.1% of enrolled households by 31 August 2020. It is clear that 100 days of work does not offer adequate protection to vulnerable households, especially considering that MNREGA wages continue to be very low (Aggarwal and Paikra 2020). Some states have already requested an expansion of the minimum guarantee to 200 days per household under the programme. Delays in wage payments and rejected payments continue to remain serious problems. Further, barriers to accessing jobs – owing to the lack of a job card and so on – need to be reduced to enable greater coverage of households, especially those with return migrants, who tend not to be enrolled.
Given that the economy will take time to recover and the pandemic continues to spread in rural areas, MNREGA will continue to be a lifeline for many wage workers, especially in districts where migrants have returned in large numbers. It is important for the government to continue its support of the programme, that serves as a ‘diffused economic stimulus’ and to enhance the capacity of districts that need it most to expand and maintain the programme.
I4I is now on Telegram. Please click here (@Ideas4India) to subscribe to our channel for quick updates on our content.
Notes:
- MNREGA guarantees 100 days of wage-employment in a year to a rural household whose adult members are willing to do unskilled manual work at state-level statutory minimum wages.
- The lockdown was announced on 24 March 2020 and was in place until 30 May 2020, after which activities resumed in a phased manner, across most states.
- We draw on migration data as computed with data from the Census 2011 and National Sample Survey 2007-2008 by Imbert (2020) and compute a Multidimensional Poverty Index with data from the National Family Health Survey 4, 2015-16 following Alkire et al. (2020). We map current districts to the Census 2011 districts to conduct the analysis.
- A tercile is any of the two points that divide an ordered distribution into three parts, each containing a third of the population.
- A 95% confidence interval (CI) is a way of expressing uncertainty about estimated effects. Specifically, it means that if you were to repeat the experiment over and over with new samples, 95% of the time the calculated confidence interval would contain the true effect.
Further Reading
- Aggarwal, A and V Paikra (2020), ‘Why are MNREGA wages so low?’, Ideas for India, 5 October.
- Alkire, S, C Oldiges and U Kanagaratnam (2020), ‘Multidimensional poverty reduction in India 2005/6–2015/16: Still a long way to go but the poorest are catching up’, Oxford Poverty and Human Development Initiative Research in Progress 54b, University of Oxford.
- Drèze, J (2020), ‘The need for a million worksites now’, The Hindu, 25 May.
- Drèze, J and C Oldiges (2011), ‘Employment Guarantee: The Official Picture’, in R Khera (ed.), The Battle for Employment Guarantee, Oxford University Press, New Delhi.
- Imbert, C (2020), ‘Covid-19: Expected migrant movement as lockdown eases’, Ideas for India.
- People's Action for Employment Guarantee (2020), ‘NREGA in Bihar’.
- Saxena, N (2016), ‘Why PMGSY has performed better than MGNREGS?’, Inclusion: Mainstreaming the Marginalized, February 2.

By: Shyamadas Banerji 02 December, 2020
It would have been useful to include in the research whether these additional days of employment generated productive output and by how much. Also the gender breakdown of additional employment and what types of jobs were created. I realize that this is a safety net program to sustain unemployed people but if the program is to provide income to the unemployed, why not just make a cash payment and do away with the charade of providing employment which may be totally unproductive.