

 01 July, 2021


Despite being illegal since 1961, dowry continues to be a widespread phenomenon in rural India. In the first of a two-part series, this article tracks the evolution of dowry during 1960-2008 across states, and religious and social groups. It finds that as a share of household income, dowry has gradually declined at the national level – with some states and religious groups showing an increase during this period.
The ancient custom of dowry, that is, bride-to-groom transfers at the time of marriage, remains ubiquitous in several countries. In this article, we focus on rural India, where dowry remains a widespread phenomenon despite being illegal since 1961 – according to the 2006 Rural Economic and Demographic Survey (REDS), dowry was paid in 95% of marriages during 1960-2008. Dowry per marriage often amounts to several years of household income and imposes a substantial burden on girls’ families. However, little is known about the evolution of dowry in recent decades that have witnessed remarkable economic and social change.
Whether India has been experiencing dowry inflation has been a subject of lively debate, both in popular and academic discussions on dowry. In this article, we assess whether, and how, dowry payments have changed over time and across states, castes, and religions in rural India by using data on roughly 40,000 marriages that took place during 1960-2008 (Anukriti et al. 2020).
Our analysis is based on data from 2006 REDS – the most recent source of dowry data for India – covering 17 major states that contain about 96% of India’s population. Using information on the value of gifts received or given at the time of marriage, we compute net dowry as the difference between the value of gifts given by the bride’s family to the groom or his family, and the value of gifts given by the groom’s family to the bride’s family. Our key findings are discussed below.
Average net dowry has been remarkably stable over time with some inflation before 1975 and after 2000 (Figure 1). This trend in net dowry is mimicked by the trend in gross payments by the bride’s family to the groom’s family. The flow of payments in the opposite direction, that is, from the groom to the bride, is also positive throughout, but substantially smaller. While on average, a groom’s family spends about Rs. 5,000 (in real terms) on gifts to the bride’s family, gifts from the bride’s family cost seven times more, that is, about Rs. 32,000, implying an average real net dowry of Rs. 27,000.
Figure 1. Trends in real net and gross dowry, by year of marriage
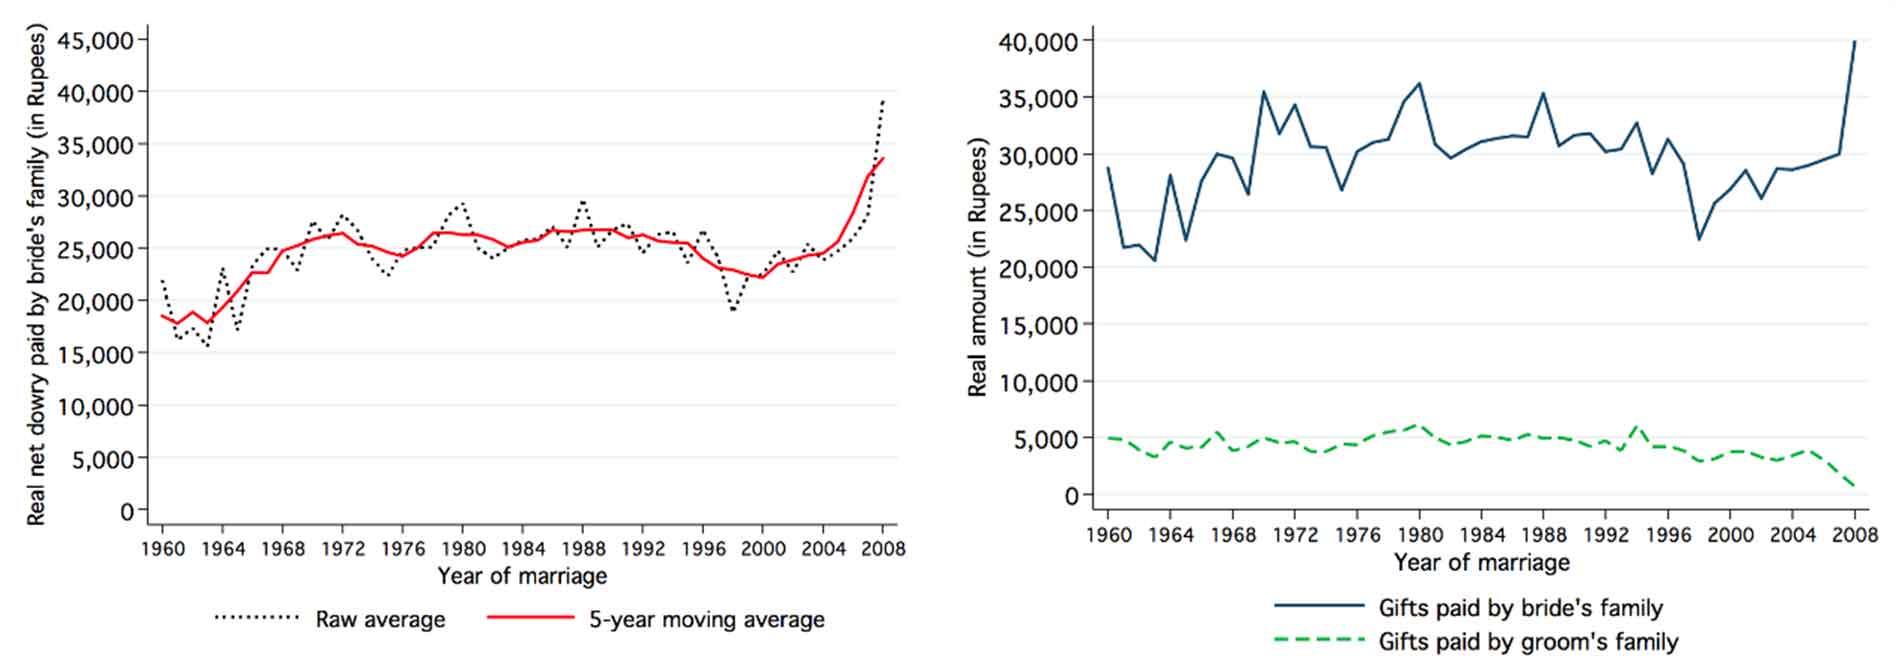
Notes: (i) The left panel plots the raw unweighted average and the unweighted five-year moving average of the net dowry paid by the bride’s family, by year of marriage. (ii) The right panel plots the raw unweighted average of real payments from the bride’s family and from the groom’s family, by year of marriage.
The proportion of marriages with a negative net dowry, that is, where the groom’s family paid more to the bride’s family than the other way around, is non-zero, but quite small. Most marriages involved positive net dowry payments to the groom’s family. As per capita incomes have risen in India during our study period, these stable trends imply that, on average, dowry as a share of household income has gradually declined at the national level.
Dowry is prevalent in all major religious groups in India (Figure 2). The trend for Hindus is similar to the national trend – which is not surprising as Hinduism is the majority religion in India (89% of our sample is Hindu). More importantly, it is also quite clear from the graph that dowry is not just a Hindu phenomenon in India. Average net dowry in Muslim marriages is only slightly lower than among Hindus and has remained stable through the study period. In contrast, Christians and Sikhs exhibit a striking increase in dowry over the same period, leading to higher average dowries than Hindus and Muslims.
Figure 2. Trends in real net dowry by religion and caste, by year of marriage
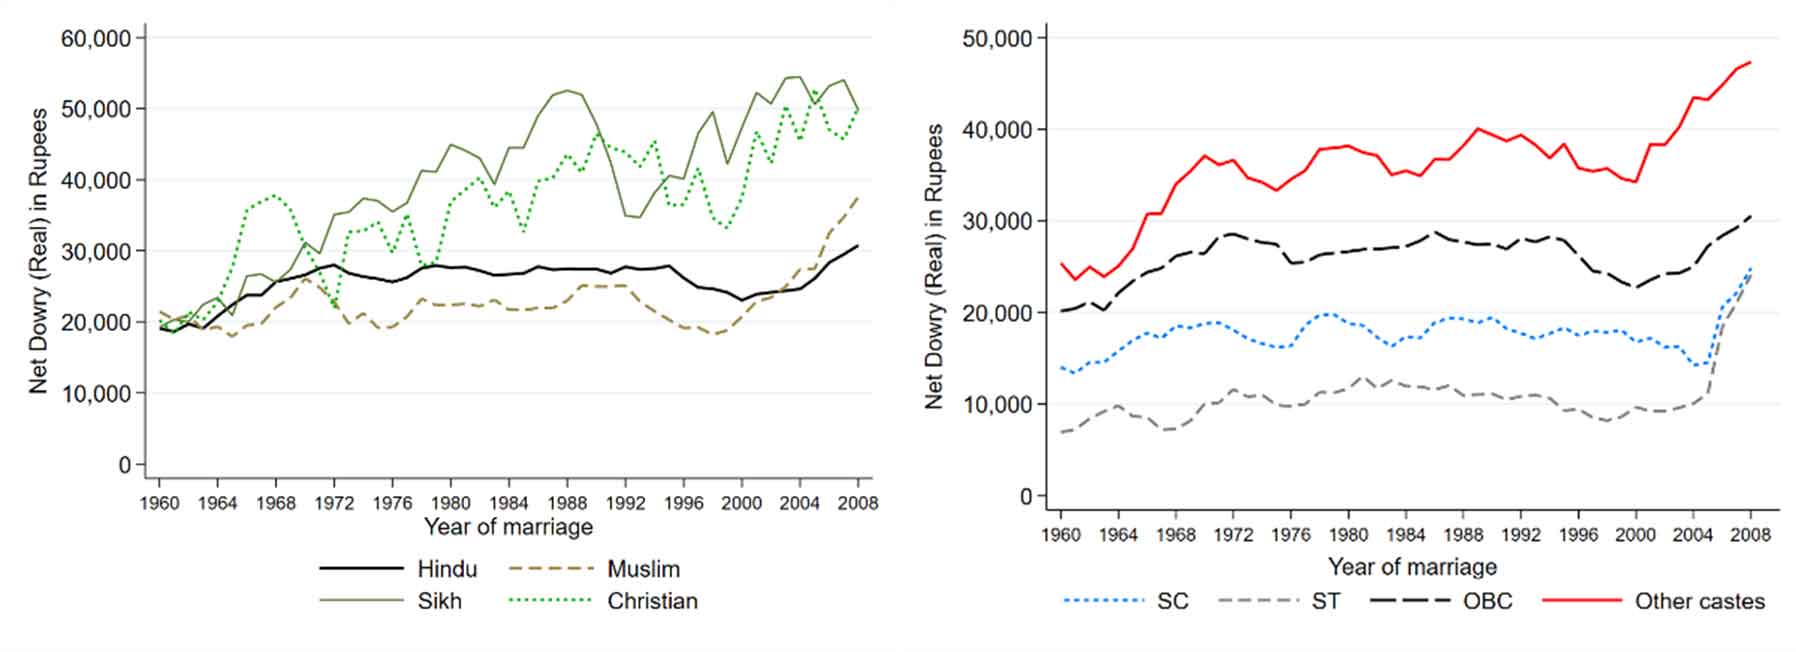
Notes: (i) This figure plots the five-year moving unweighted average of real net dowry paid by the bride, by year of marriage and religion (left panel) or caste (right panel) during 1960-2008. (ii) All religions are included within a caste group. SC, ST, and OBC respectively denote Scheduled Castes, Scheduled Tribes, and Other Backward Classes.
Dowry is positively correlated with higher caste status, and the caste hierarchy of dowry payments has not changed over time (Figure 2). Upper caste marriages have the highest dowries, followed by Other Backward Classes (OBCs), Scheduled Castes (SCs), and Scheduled Tribes (STs).
Although the trend in average dowry is flat at the national level, there are substantial differences across states over time (Figure 3). Kerala exhibits stark and persistent dowry inflation since the 1970s and has the highest average dowry in recent years. Other states with inflationary trends are Haryana, Punjab, and Gujarat. Given Kerala’s religious composition – 26% Muslims, 18% Christians, and 55% Hindus – this trend is compatible with the differential trends by religion described earlier. Similarly, the inflationary trend in Punjab – a majority Sikh state – is also consistent with the rise in Sikh dowries. On the other hand, average dowry decreased in Odisha, West Bengal, Tamil Nadu, and Maharashtra.
Figure 3. Trends in real net dowry, by state and year of marriage
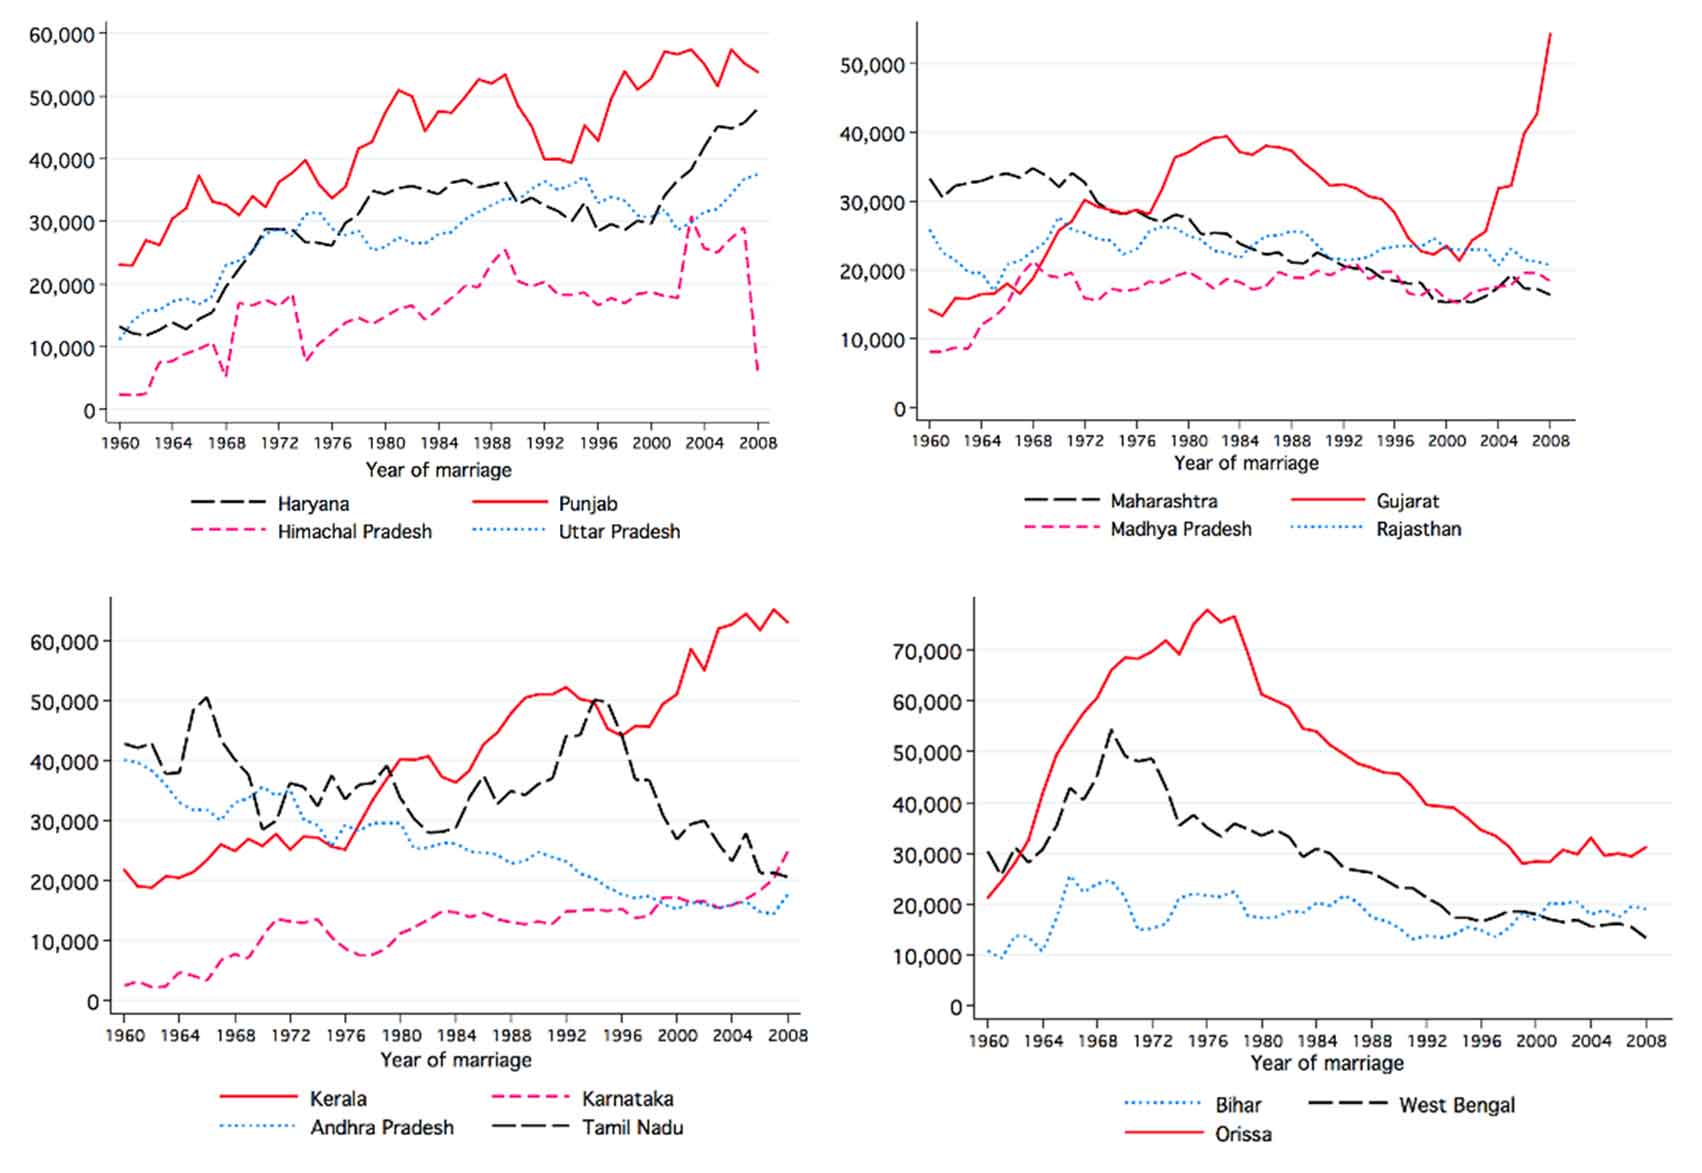
Notes: This figure plots the five-year moving, unweighted average of real net dowry paid by the bride, by year of marriage across states.
This article is the first in a two-part series. The next part will focus on how dowry influences household decision-making and intertemporal resource allocation. The series is published in collaboration with the World Bank’s Let’s Talk Development Blog.
I4I is now on Telegram. Please click here (@Ideas4India) to subscribe to our channel for quick updates on our content.
Further Reading
- Anderson, Siwan (2003), “Why Dowry Payments Declined with Modernization in Europe but Are Rising in India”, Journal of Political Economy, 111(2): 269-310. Available here.
- Anderson, Siwan (2007), “Why the Marriage Squeeze Cannot cause Dowry Inflation”, Journal of Economic Theory, 137(1): 140-152.
- Anukriti, S, S Kwon and N Prakash (2020), ‘Savings for Dowry: Evidence from Rural India’, World Bank Policy Research Working Paper 9453.
- Chiplunkar, G and J Weaver (2019), ‘Prevalence and evolution of dowry in India’, Ideas for India, 24 June.
- Chiplunkar, G and J Weaver (2019), ‘Marriage markets and the rise of dowry in India’, Working Paper.
- Edlund, Lena (2006), “The Price of Marriage: Net vs. Gross Flows and the South Asian Dowry Debate”, Journal of European Economic Association, 4(2/3): 542-551.
- Logan, Trevon D and Raj Arunachalam (2014), “Is there Dowry Inflation in South Asia”, Historical Methods, 47: 81-94.
- Rao, Vijayendra (1993a), “The Rising Price of Husbands: A Hedonic Analysis of Dowry Increases in Rural India”, Journal of Political Economy, 101(4): 666-77.
- Rao, Vijayendra (1993b), “Dowry ‘Inflation’ in Rural India: A Statistical Investigation”, Population Studies, 47(2): 283-293.

Comments will be held for moderation. Your contact information will not be made public.