

 16 March, 2018


This column investigates the relationship between economic growth and net job creation in India and South Asia. If economic growth was truly jobless, as is often claimed, labour productivity would be increasing very rapidly. But how real is the alleged joblessness?
Tweet using #productivity
Job creation is one of the main concerns of politicians and policymakers around the world. If anything, the concern is more pronounced in India, where the demographic transition is swelling the ranks of the working-age population. Between 2001 and 2011, the number of Indians aged 15 and above grew by 1.45 million per month, a trend that will only moderate gradually over time. Many of the entrants in this group are staying in school for longer than their predecessors, and many may never seek a job. But still, slightly more than half of India’s working-age population is working at present. Maintaining this ratio would require the net creation of 0.75 million jobs per month, or about 9 million per year. This is more than the population of half of the countries in the world! The concerns of Indian politicians and policymakers are therefore understandable.
Slow generation of good jobs in India
There is also considerable anxiety that despite its remarkable economic growth, India is not generating jobs at a speed that is commensurate with the demographic transition, and that the ‘quality’ of the jobs created is not high. There is consensus that net job creation has fallen short of the growth of the working-age population, by a large margin. There is also consensus that employment rates among women have been falling steadily. And only a fraction of the jobs created take the form of regular wage employment, with self-employment and casual work remaining the norm.
It could be argued that the concerns are overstated. Open unemployment rates remain low in India, and the withdrawal of women from the labour force could just reflect a voluntary decision, as higher family incomes now allow women to dispense with the hardship of working on the farm, or the insecurity of traveling to work outside the home. The speed at which India has reduced poverty gives credence to this viewpoint. Between 1994 and 2012, the share of the population living below the official poverty line was halved, from 45% to 22%, and the trend accelerated towards the end of this period. Labour earnings, from both self-employment and wage employment, accounted for nearly 90% of household income in 2012. And changes in labour income were the main contributor to poverty reduction (Chatterjee et al. 2016). Seen from this perspective, the labour market is doing very well, thank you!
But there are good reasons to dispute this upbeat interpretation. Unemployment rates may not be very informative in developing countries, where few can afford to remain idle for long, and where many ‘jobs’ are characterised by under-employment and precariousness. The withdrawal of women from the labour force may be ‘voluntary’, but still suboptimal from a social point of view. Inside the household, it is not clear that choices reflect the preferences of husbands and wives to the same extent. And paid work is a source of agency for women, with positive social spillovers. The package of measures adopted by India in 2016 to support its apparel industry was predicated on this basis (Subramanian and Verma 2016). The World Development Report on ‘Jobs’ makes an even broader case, arguing that jobs connected to global markets or jobs for youth can have also positive spillovers through their impacts on learning or on social cohesion (World Bank, 2012). A well-functioning labour market may not be sufficient to internalise these spillovers, and deliver enough “good jobs for development”.
Data constraints
While complacency on job creation is unwarranted, clarity on how the Indian economy is doing on employment is limited. Data constraints are at the core of this fuzziness. Employment figures are not available with high frequency, and labour indicators differ in subtle but important ways across statistical instruments. Population censuses, economic censuses, household surveys, and labour force surveys all define employment in different ways. Gaps between definitions are amplified in economies where self-employment and casual work are the norm. A nine-to-five job, with a written contract and benefits attached to it, is easy to recognise. But relatively few jobs match this description, and in many other cases, it is difficult to tell whether the person is working, unemployed, or out of the labour force.
In India, for example, NSSO (National Sample Survey Organisation) surveys show a decline in female labour force participation over time, while Population Censuses report a stable participation rate but an increase in female unemployment. In Bangladesh, the employment rate for 2016 is 53% according to the Labour Force Survey, but 44% based on the Household Income and Expenditure Survey. With gaps of this sort, assessing how employment is responding to economic growth becomes challenging.
Relationship between growth and jobs in South Asia
The relationship between economic growth and jobs is often interpreted in connection with Okun’s Law, which posits that when growth accelerates the unemployment rate falls below its “natural” level. This regularity is central to modern macroeconomic analysis and a key tool for policymaking (Ball et al. 2017). The intuition is simple: if growth is above potential the demand for labour increases; given that the labour force is stable in the short term, the unemployment rate must decline.
So far, most of the empirical research on this relationship has focused on advanced economies. One of the few studies available for developing countries argues that the relationship is half as strong in their case, and varies considerably across countries (Ball et al. 2016). But the weakness of the relationship is not surprising, given that unemployment is a poor indicator of the situation in the labour market when people are too poor to afford being idle. And the heterogeneity across countries could be anticipated, given the diverse ways in which employment (hence unemployment) are measured across countries and survey instruments.
A naïve estimation of Okun’s Law for South Asian countries, using readily available data from the International Labour Organization (ILO), confirms the weakness of the relationship. The results in Table 1 are based on a specification in which deviations of growth from its potential are regressed on deviations of unemployment or employment rates from their trend. The estimated relationship has the expected size and significance in the cases of Pakistan and Sri Lanka, where one percentage point of economic growth increases the employment rate by roughly 0.16% (and reduces the unemployment rate accordingly). But this is still half of the impact observed in Germany, and a third of that in the US. The relationship estimated for Sri Lanka and Pakistan is also weaker than in other developing countries like Russia, Brazil, or the Philippines. And the relationship is statistically insignificant in other South Asian countries, including India. Seen from this perspective, it could be tempting to conclude that growth is indeed jobless.
However, one reason why Okun’s Law may seem to hold in Pakistan and in Sri Lanka is that these two countries have the most frequent labour force surveys in the region. Which raises the question whether the problem is with the relationship between growth and jobs in South Asia, or rather with the quality of the available labour market data.
Table 1. Employment response to growth in South Asia and in selected countries
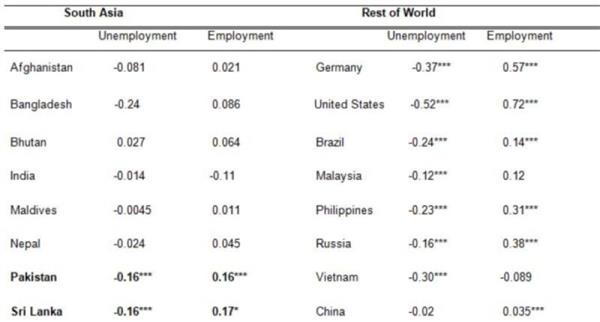 Note: All regressions use annual data based on ILO estimates from 1991 to 2016 and are estimated as deviation from potential or trend. The coefficients in the right panel are from Ball et al. (2016).
 To answer this question, we compile a comprehensive database of labour market outcomes in South Asia, standardising indicators across countries and over time to the maximum extent possible. There are around 100 censuses and surveys that provide information on employment (and often on labour force participation and unemployment) in South Asian countries for the period since 2000. To ensure the comparability of definitions, we go back to the original questionnaires and reprocess individual records in a consistent way. This harmonisation process involves, for instance, deciding whether to focus on the primary job only, or also on other activities; it also involves deciding whether fetching water and collecting firewood qualify as work. We document these decisions so that our analyses are fully transparent and replicable.
Differences remain despite these efforts, but to the extent that they are clearly identified they can be addressed through statistical methods. The basic specification of Okun’s Law can indeed be adjusted to this effect. Instead of ‘just’ regressing changes in employment rates on changes in growth rates, fixed effects can be estimated for each survey instrument.
Importantly, our database allows to generate employment information with relatively high frequency. Population censuses and economic censuses are conducted over relatively short periods of time. It is therefore possible to attribute their employment observations to the quarter when enumerators were in the field. Household surveys are often run on an annual basis, but information is available on when the interviews took place, and this in turn allows mapping individual observations to specific quarters. Not all countries in South Asia have quarterly growth data to match. But India and Sri Lanka do. And in other countries annual growth series can be decomposed quarterly using ancillary information, such as the intensity of nightlight.
Preliminary results are promising. For instance, in India’s case the annual changes in employment reported by the ILO are not correlated with annual changes in the economic growth rate, as shown in the left panel of Figure 1. However, the quarterly changes in employment we computed using the “thick” rounds1 of the NSSO are positively correlated with quarterly growth rates, as shown in the right panel. When estimating an Okun’s Law regression with this quarterly data, the coefficient has the right sign. Although it is not statistically significant yet, the fit of the regression can be expected to improve as more surveys are processed. Taken at face value, the estimated coefficient implies that employment is slightly more responsive to economic growth in India than in Pakistan or Sri Lanka.
Figure 1. Employment rate is responsive to economic growth in India
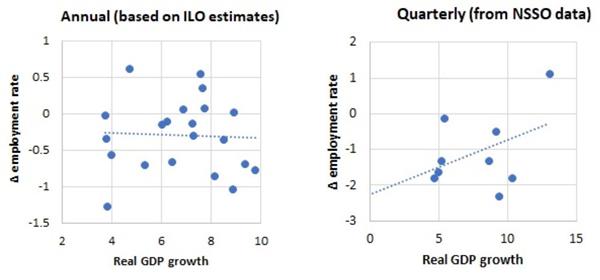 Note: The left figure uses data based on ILO estimates from 1996 to 2016 and the right panel uses quarterly data computed from the thick rounds of NSSO.
 This is still work-in-progress, but similar preliminary analyses for other countries in the region suggests that a statistical approach may shed light on the relationship between growth and jobs in South Asia, and in India in particular. Moreover, the data can also be disaggregated in ways that allow addressing the concerns of politicians and policymakers. By splitting the data by gender it is possible to assess how differently male and female employment react to economic growth. Other relevant employment breakdowns are by sector of activity (agriculture, construction, manufacturing, services), by type of job (self-employment, casual worker, regular wage earner), and by institutional sector (private and public). The same elasticity of employment to economic growth2 is more reassuring when it involves more employment among women, or more regular wage jobs.
Detailed results will be presented in the next edition of South Asia Economic Focus, a bi-annual regional publication of the World Bank, to be issued in mid-April 2018.
Notes:
- NSSO data is collected in two rounds: quinquennial (or “thick”) rounds done at approximately five-year intervals on a large sample of households and “thin” rounds undertaken during intervening periods on smaller samples.
- Employment elasticity is a measure of the percentage change in employment associated with a percentage point change in economic growth.
Further Reading
- Ball, Laurence, Daniel Leigh and Prakash Loungani (2017), “Okun's Law: Fit at 50?”, Journal of Money, Credit and Banking, 49(7):1413-1441.
- Ball, L, D Furceri, D Leigh and P Loungani (201?), ‘Does One Law Fit All? Cross-country Evidence on Okun’s Law’, unpublished manuscript, International Monetary Fund, Washington DC.
- Chatterjee, U, R Murgai, A Narayan and M Rama (2016), ‘Pathways to Reducing Poverty and Sharing Prosperity in India: Lessons from the Last Two Decades’, The World Bank, Washington DC.
- Subramanian, A and R Verma (2016), ‘Stitching up employment’, The Indian Express, 23 June 2016.
- World Bank (2012), ‘World Development Report 2013: Jobs’, Washington DC.

Comments will be held for moderation. Your contact information will not be made public.