

 08 June, 2021


As India combats the second wave of Covid-19, the impact on economic activity remains a major concern. Drawing lessons from the first wave in 2020, this article provides an assessment of how containment measures have influenced aggregate economic outcomes. It finds that economic recovery was lower by 9.3% in districts where mobility restrictions were maximum – relative to those with minimal restrictions – and incomes were hit harder than consumption.
India is currently battling a second wave of the Covid-19 pandemic, which has affected an estimated 26.5 million people (as of 23 May 2021), with covid19India.org reporting 0.3 million deaths cumulatively. In this situation, one widely adopted approach to combating Covid-19 infections is restricting mobility. During the first wave of infections in India during March-May 2020, the Government of India implemented the “world’s strictest lockdown” (Hale et al. 2020). This lockdown severely disrupted business activity and mobility, with millions of migrants traveling back to their villages as opportunities for work in the cities dried up.
The rationale behind implementing lockdowns is to curtail the spread of Covid-19 and to reduce the consequent burden on the healthcare system to save lives. In addition, lockdowns may allow for quicker resumption of normal economic activity over time. However, the trade-off from lockdowns are short-run reductions in economic activity. A lockdown potentially affects developing countries more as the practice of remote working is less prevalent and extent of digitisation is lower as compared to advanced economies. A larger share of households depend on daily incomes, and the social protection architecture is weaker. In recent research (Beyer, Jain and Sinha 2020), we examine the economic implications of a graded ‘unlock’ in May and June 2020 when the central government decided to vary containment rules across districts in the country. As questions regarding the impact of the ongoing second wave concern policymakers, we provide estimates of aggregate economic costs in the short run that a developing country could face from Covid-19 containment strategies by examining the Indian case of lockdown strategies.
How did zonal containment impact economic activity?
The Government of India announced a comprehensive nationwide lockdown on 25 March 2020, which was implemented uniformly across all states and districts (Bhalla 2020). During this phase, nearly all offices, commercial and private establishments, industrial units, as well as public services were closed. Most transportation services – including international and domestic flights, railways, and roadways – were suspended. Hospitality services and educational institutions were shut. This nationwide lockdown lasted till 3 May 2020. A detailed study by researchers from the World Bank found that night-time light intensity in India dimmed during the strict national lockdown in March and April compared to earlier months (Beyer, Franco-Bedoya and Galdo 2021).
To facilitate a gradual resumption of economic activity, the government announced a differentiated unlock of districts with three zone categories (130 districts as Red zone1 districts, 284 as Orange zone districts, and 319 as Green zone districts; see Figure 1). Starting 4 May 2020, districts were categorised based on multiple criteria including the incidence of cases, the extent of testing, and vulnerability to the pandemic. District-level mobile phone location data from Google and Facebook corroborated that these restrictions were indeed effective in reducing mobility as the government mandated. Using a difference-in-difference2 methodology, we measure the impact of these varied zone classifications on high-frequency, night-time light intensity3, a commonly used proxy for aggregate economic activity, during the months of May and June 2020, controlling for the uniform lockdown period of March-April 2020.
Figure 1. District-wise containment zones
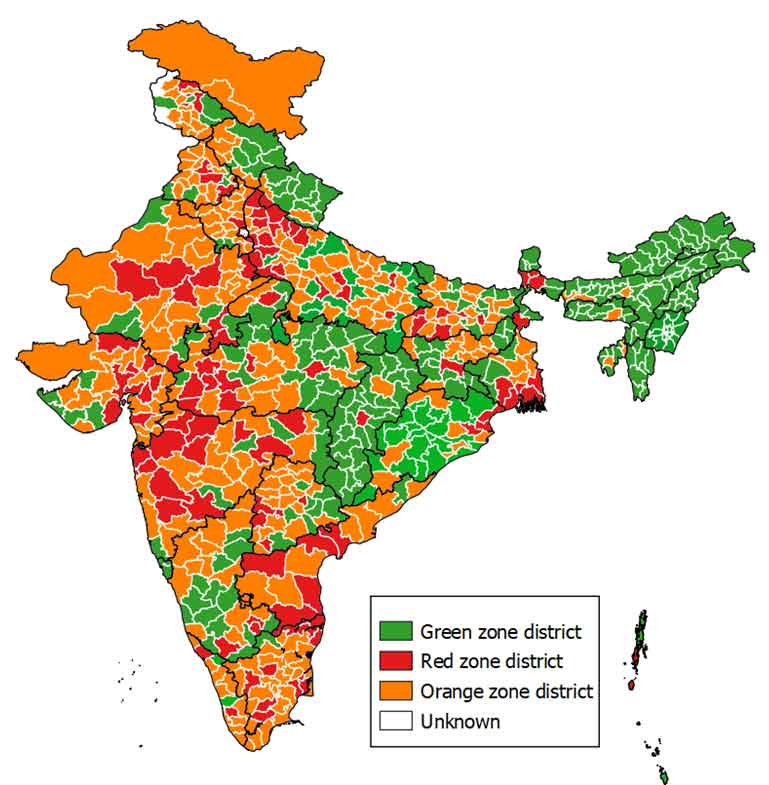
Source: Authors’ image.
With this framework, our central finding is that the economic recovery, as measured by night-time light intensity, was lower by 9.3% in Red zone districts (where restrictions were maximum) relative to Green zone districts (with minimal restrictions). The same measure indicated that the recovery was 1.6% lower in Orange zone districts compared to Green zone districts. These results are not driven by India’s large metropolitan cities and hold even when they are excluded from the analysis.
We extended the analysis to examine the impact of the Red/Orange/Green zones on household-level consumption and income. Using monthly surveys of Indian households conducted by the Centre for Monitoring Indian Economy (CMIE), we observe that lower household income and reduced consumption are important channels through which the zone-wise restrictions impacted night-time light intensity. Some districts were more impacted by the restrictions than others. More developed districts with above-median population density, share of employment in services, credit per capita, and average age, experienced larger impacts. Finally, varying degrees of MNREGA4 (Mahatma Gandhi National Rural Employment Guarantee Act) operations, a large public-works programme deployed as a counter-cyclical measure, as well as inter-district migrant shares (which proxy for reverse migration after the lockdown) have had no impact on these dynamics.
Discussion
As India battles a second Covid-19 wave (accompanied by viral mutations) in 2021, state governments in India have imposed new mobility restrictions while trying to maintain economic activity. Our results suggest that the mix of state-wise lockdowns and micro-containment zones currently being implemented could lead to less-severe economic impacts than the enactment of a national lockdown. A closer look at lessons from the first wave indicate that district-specific characteristics like age, population density, and the share of the contact-intensive services sector, are also likely to determine the extent of the impact.
Our finding that household incomes declined more than consumption in 2020, points to the importance of maintaining livelihood while battling Covid-19. In this respect, public programmes that are targetted towards employment and income generation of low-skilled workers could potentially hedge against job losses and reductions in earnings. A debate in many developing countries is whether public funds should be used to pay for vaccinations and public health expenditures. Our analysis points to the economic costs of containment measures to combat Covid-19, and so the costs of vaccinations and public health improvements should be weighed against those. We speculate that given the very high aggregate economic costs, most governments in developing countries would find that investments in vaccinations and public health pass the cost-benefit test in the context of the Covid-19 pandemic.
I4I is now on Telegram. Please click here (@Ideas4India) to subscribe to our channel for quick updates on our content.
Notes:
- The Ministry of Health and Family Welfare defines red zones (with maximum restrictions) as, “areas that will have highest caseload districts contributing to more than 80 per cent of cases in India or highest caseload districts contributing to more than 80 per cent of cases for each state in India or districts with doubling rate less than four days”, and a green zone (with minimum restrictions) is an area, “where there are zero confirmed cases of coronavirus in the last 21 days”. Those that do not belong to either of these categories are classified as orange zones.
- A technique to compare the evolution of outcomes over time in similar groups that were exposed a particular intervention with those that did not.
- As measured by Visible Infrared Imaging Radiometer Suite (VIIRS) and made available in raw form by the Colorado School of Mines.
- MNREGA guarantees 100 days of wage-employment in a year to a rural household whose adult members are willing to do unskilled manual work at the prescribed minimum wage.
Further Reading
- Beyer, Robert CM, Sebastian Franco-Bedoya and Virgilio Galdo (2021), “Examining the economic impact of COVID-19 in India through daily electricity consumption and nighttime light intensity”, World Development, 140: 105287. Available here.
- Beyer, RCM, T Jain and S Sinha (2020), ‘Lights out? COVID-19 containment policies and economic activity’, World Bank Policy Research Working Paper 9485.
- Bhalla, A (2020), ‘Order No.40-3/2020-DM-I(A)’, Ministry of Home Affairs, Government of India.
- Hale, T, S Webster, A Petherick, T Phillips and B Kira (2020), ‘Oxford COVID-19 government response tracker’, Blavatnik School of Government.

Comments will be held for moderation. Your contact information will not be made public.