

 10 June, 2019


The average turnaround time of Indian ports has come down significantly since 2010, indicating improvement in their operational efficiency. However, it still is more than two times the level in some of the best-performing ports in the world. This article provides estimates showing that if the average turnaround time could be cut down by 50%, India’s manufacturing exports may increase by at least 20-25%.
India’s exports of manufactured products have grown rather slowly since 2012-13. Between 2002-03 and 2011-12, the growth rates in the US$ value of India’s manufacturing exports ranged between 17% and 37% in different years, except for 2009-10 when there was a fall.1 The average annual growth rate was about 20%. By contrast, in the period 2012-13 to 2017-18, the growth rate in the US$ value of India’s manufacturing exports has been 8% or less (negative in two years), and the average annual growth rate was only about 3%.
The low growth rate of India’s manufacturing exports since 2012-13 is attributable basically to the marked slowdown in global trade that has taken place in this period. Yet, even in the face of a slow-moving global market of manufactured products, India now needs a major step-up in the growth rate in exports of such products in order to substantially raise the growth rate of Indian manufacturing. This will help in attaining rapid economic growth in the country in the years ahead and create employment opportunities for the youth, who would be entering the Indian labour markets in large numbers in the coming years.
Giving a major boost to manufacturing exports from India in the current global economic scenario appears difficult. However, this might still be possible with a multi-pronged strategy directed at considerably enhancing competitiveness of Indian manufacturing firms – focusing on innovation and technological advancement, skill formation, infrastructure development, provision of efficient services as an input in manufacturing, etc. One important element of such a strategy lies in improved operational efficiency of Indian ports, aimed at cutting down trading costs and facilitating greater participation in global value chains.
Trends in operational efficiency of ports
An important indicator of the operational efficiency of ports is the turnaround time or Turn Round Time (TRT) – defined as the time spent by a vessel at the port from its arrival at the reporting station to its departure from the reporting station. Analysis of the trends for TRT in respect of major Indian ports for the period 2001-02 to 2016-17 reveals that there was, at the port-average level, an upward trend in this indicator (suggesting fall in efficiency) during 2003-04 to 2010-11, and a downward trend (suggesting improvement) thereafter (Figure 1). The average TRT of major ports in 2010-11 was about 5.3 days, which came down in 2016-17 to about 3.4 days. A similar trend is seen in another operational efficiency indicator, namely pre-berthing waiting time or detention (PBD), measured as the number of days of detention/delay before berthing of vessels, on average, during the year.
Figure 1. Turnaround time (TRT) and pre-berthing detention (PBD), India's major ports (average)
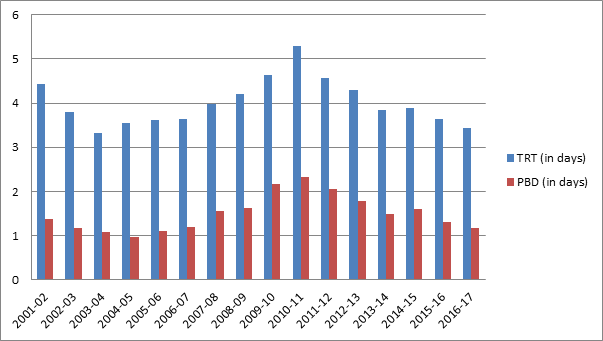
Source: Prepared by authors using data on TRT and PBD taken from Indiastat.com and other sources. The basic source of these data is the Ministry of Shipping, Government of India.
In terms of two other port efficiency indicators, namely berth occupancy rate (BOR) (ratio of time a berth is occupied by a vessel to the total time available during a period), and the percentage of idle time at berth to time at working berth (PIT), no significant improvement has taken place in the post-2010 period. On the other hand, there has been a clear upward trend in output per ship berth-day, which has risen from 9,140 tonnes in 2010-11 to 14,576 tonnes in 2016-17. Thus, overall, there has been a significant improvement in port operation efficiency in India in the period 2010-11 to 2016-17.
International benchmarking
The downward trend in TRT (hence, improvement in port efficiency) during 2010-11 to 2016-17 has continued subsequently. The average TRT came down from 82.3 hours in 2016-17 to 64.3 hours in 2017-18, and further to 60.5 hours in 2018-19 (up to 31 October 2018) (Government of India, 2018). However, even with this fall, the average TRT level in India’s major ports reached now still remains more than two times the TRT level in some of the best-performing ports in the world. The ship turnaround time in some international ports in 2014 was less than one day in the ports of Kelang/Klang, Shanghai, Yokohama, Barcelona, and Tarngier, and it was between one and two days in Singapore, Hamburg, Rotterdam, and Antwerp (Ports Regulator of South Africa, 2016). A comparison made of vessel turnaround time for 2010, between some Indian ports and some international ports in a report of the Planning Commission brings out that the turnaround time was 46 hours in Cochin, and 28 to 32 hours in Chennai, Tuticorin, and J.L. Nehru Port, whereas it was only 13 hours in Hong Kong, and 14 hours in Singapore.
Figure 2. Average turnaround time (in days) in major ports
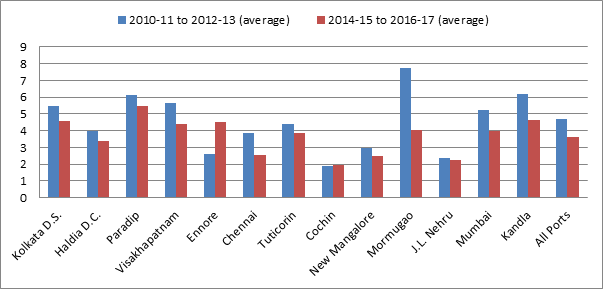
Source: Same as Figure 1.
The average level of TRT during 2014-15 to 2016-17 was around or more than four days in several major Indian ports (Figure 2). By contrast, there are some ports, where TRT is about two days or even less. Considering the wide variation in TRT across Indian ports and their present level vis-à-vis international benchmarks, it seems that there is scope for a substantial reduction in TRT. Perhaps, a reduction in average TRT of India’s major ports by 50% is not an unrealistic target to aim for.
Impact of a lower TRT on export performance
Empirical economic literature on the relationship between port efficiency and export performance indicates that delay in transportation or in completion of export/import procedures reduces volume of trade and the number of firms that take part in international trade (see, for example, Djankov et al. 2010). Analysing the impact of TRT on exports for Brazil using data for 2010-2012, Sant’Anna and Kannebley Junior (2018) find that additional delay by one hour in an average port causes nearly 2% reduction in relative local exports. Accordingly, they conclude that a 10% reduction in total TRT can raise Brazilian exports by about 5%.
We have carried out an analysis of the impact of operational efficiency of Indian ports on manufacturing exports from India using data on 11 major Indian ports2 and six major categories of manufactured products3 for the years 2001-02 to 2014-15 (Goldar and Paul 2018). The estimates indicate than an increase in TRT by one day causes manufacturing exports to decrease by about 18-20%. Another finding is that an increase in PBD (which is a component of TRT) by half-a-day causes manufacturing exports to decrease by about 14-16%. These estimates are broadly in line with the estimates for Brazil mentioned above (since the estimated impact of a 10% cut in TRT in the case of India is not much different from that for Brazil).
In conclusion, it has been mentioned above that a 50% cut in average TRT in Indian ports is not an unrealistic target to aim for. If this reduction could be made, then according to our impact parameter estimates for Indian exports, it would probably lead to an increase in India’s manufacturing exports by about 20-25% or more. Evidently, efforts are needed at process streamlining and improvement in other aspects of port operations so that a substantial reduction is made possible in TRT in Indian ports.
Notes:
- Based on data on India’s exports reported in RBI’s (Reserve Bank of India) Handbook of Statistics on the Indian Economy 2017-18, and earlier issues.
- The ports considered for the analysis are: Kolkata, Paradip, Vishakhapatnam, Chennai, Tuticorin, Cochin, New Managalore, Mormugao, Jawaharlal Nehru (Nhava Sheva), Mumbai, and Kandla.
- The product categories included in the analysis are: Chemicals and chemical products; Metals and metal products; Machinery; Transport equipment; Textiles; and Food products and beverages.
Further Reading
- Djankov, Simeon, Caroline Freund and Cong S Pham (2010), “Trading on time”, Review of Economics and Statistics, 92(1): 166–173.
- Goldar, B and M Paul (2018), ‘Impact of Port Infrastructure Development and Operational Efficiency of Ports on Export Performance: A study of manufactured product exports from India’, Paper presented at the 14th Annual Conference on Economic Growth and Development, 19-21 December 2018, Indian Statistical Institute, New Delhi.
- Government of India (2018), ‘Year End Review 2018 – Ministry of Shipping’, Press Information Bureau, 13 December 2018.
- Planning Commission (2014), ‘India Transport Report: Moving India to 2032’, Report of the National Transport Development Policy Committee (NTDPC), Vol. III, Government of India.
- Ports Regulator of South Africa (2016), ‘Port Benchmarking Report: SA Port Terminals (2015/16)’.
- Reserve Bank of India (2018), ‘Handbook of Statistics on the Indian Economy 2017-18’, Mumbai.
- Sant’Anna, Vinıcios P and Sergio Kannebley Junior (2018), “Port efficiency and Brazilian exports: A quantitative assessment of the impact of turnaround time”, World Economy, 41(9): 2528-51.

Comments will be held for moderation. Your contact information will not be made public.