

 22 April, 2015


The corporate sector is the linchpin of the ‘Make in India’ campaign. This column finds that the sector is increasingly relying on imported inputs and its net foreign earnings are on the decline, thus contributing to the country’s current account deficit. It suggests that ‘Make in India’ should emphasise domestic procurement of inputs and strengthen technological capabilities in the country.
The much acclaimed ‘Make in India’ campaign is a shot in the arm to external liberalisation, which was ushered in about two decades ago. The private corporate sector, which has increased its role in Indian manufacturing over the years (Rajakumar 2011), has been the linchpin of the campaign. This leads to the question of how the private corporate sector has responded to the trade liberalisation of the 1990s.
With increased opening up, companies may have increased their export orientation as well as import dependence, in order to sustain their competitive advantage. From our country’s balance of payments (BoP)1 point of view, what matters most is how much corporates earn in foreign currencies relative to their spending in foreign currencies.
As an institutional category, corporate sector consists of both Indian and foreign direct investment (FDI) companies. In this column, I make an attempt to examine foreign exchange earnings and spending of corporates in India, by considering Indian companies separately from FDI companies (Rajakumar 2014).
Indian vs. FDI companies
A problem often encountered while undertaking analyses of this kind is with respect to data. I have relied on the Reserve Bank of India’s (RBI) annual studies of finances of non-government non-financial companies, which are based on a sample of companies and are published in its monthly Bulletin. In this series, RBI brings out three separate studies pertaining to public limited companies, private limited companies, and FDI companies2. Interestingly, FDI companies are amongst those included in RBI’s regular studies of public and private limited companies3. Using these studies, I derive a separate series for Indian companies in the following way:
All Companies RBI Sample = Public Limited Companies RBI Sample + Private Limited Companies RBI Sample
Since private corporate includes both Indian companies and FDI companies, All Companies RBI Sample = Indian companies + FDI companies RBI Sample
Rearranging the above gives:
Indian companies Derived = All Companies RBI Sample – FDI companies RBI Sample
I thus derive a separate data series for Indian companies, while retaining data collected from the studies of FDI companies.
Trends in exports and imports of corporates in India
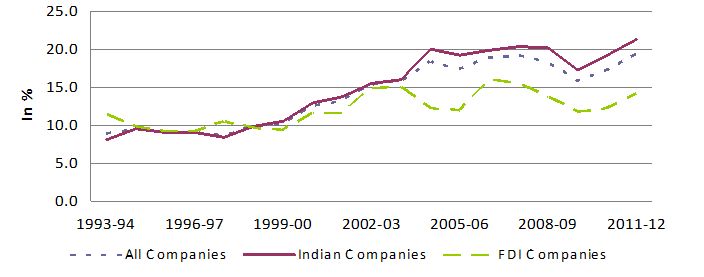
Export orientation of the corporate sector in India, whether Indian or FDI, has undoubtedly increased over the years, as shown by the rising export intensity (exports as percentage of sales) of these companies (Figure 1). With some fluctuations in between, Indian companies have considerably increased their exports from 8% of their sales in 1993-94 to 21.4% in 2011-12. Export of FDI companies was higher than that of Indian companies at 10% of their sales in the 1990s, which gradually went up to 15% in 2003-04; since then it remained more or less unchanged and stood at 14.2% in 2011-12. Over the years, Indian companies outpaced their FDI counterparts, registering higher export intensity. Indian companies have thus increased their global market orientation, whereas FDI companies have tended to remain domestic-market oriented. However, initial export enthusiasm of corporates as a whole has tapered off since 2004-05, when the domestic economy picked up unprecedented growth momentum. Perhaps the domestic market served as a substitute for the global market, given the rise in domestic incomes.
Figure 1. Exports, as % of sales

Foreign exchange spending basically has two parts, one, import of merchandise inputs (such as raw materials, components, stores and spares) and capital goods; and two, non-import spending on account of technical fees, royalties, dividends, interest, travelling expenses, professional and consultation fees, and so on. Considering these different items, I worked out the following ratios to examine import intensities:
- Raw materials and components imported as percentage of total raw material and components consumed
- Stores and spares imported as percentage of total stores and spares4 consumed
- Raw material, components, stores and spares imported as percentage of sales
- Capital goods imported as percentage of spending on purchases of capital goods
- Non-import spending as percentage of sales
The findings suggest that the corporate sector’s dependence on import of inputs has increased over the years (Table 1). Indian companies have relied more on imported raw materials and components as compared to FDI companies, except for a few years – mid-1990s, 2006-07 and 2007-08. FDI companies have relied more on imported stores and spares as compared to their Indian counterparts. As percentage of sales, total imported inputs (raw material, components and stores and spares) show a rising trend. Indian companies had a higher percentage of imported input to sales. Such increased reliance on imported inputs indicates weakened domestic sourcing of inputs. Further, it has been observed that corporates have increased their spending on import of capital goods (Table 2). While this is true for both Indian and FDI companies, the latter rely more on imported capital goods.
Table 1. Import intensity of raw materials and stores and spares (in %)
| RM&C imported: Total RM&C consumed | SS imported: Total SS consumed | RM&C and SS imported: Sales | |||||||
| All Cos. | Indian Cos. | FDI Cos. | All Cos. | Indian Cos. | FDI Cos. | All Cos. | Indian Cos. | FDI Cos. | |
| 1993-94 | 11.6 | 11.9 | 10.8 | 14.1 | 12.6 | 20.2 | 6.5 | 6.4 | 6.7 |
| 1994-95 | 14.9 | 15.0 | 14.5 | 16.2 | 14.3 | 27.2 | 8.4 | 8.3 | 9.0 |
| 1995-96 | 16.0 | 15.4 | 18.5 | 17.6 | 16.0 | 25.0 | 9.1 | 8.7 | 10.9 |
| 1996-97 | 14.4 | 14.0 | 15.9 | 17.7 | 15.6 | 28.1 | 8.2 | 7.9 | 9.7 |
| 1997-98 | 15.2 | 15.5 | 13.7 | 25.1 | 23.1 | 39.6 | 8.8 | 8.8 | 8.6 |
| 1998-99 | 14.9 | 15.2 | 13.3 | 29.7 | 22.2 | 56.8 | 8.9 | 8.8 | 9.4 |
| 1999-00 | 18.0 | 19.3 | 13.0 | 22.8 | 16.7 | 43.5 | 10.1 | 10.7 | 8.2 |
| 2000-01 | 20.3 | 22.4 | 13.4 | 25.3 | 21.5 | 36.9 | 11.4 | 12.5 | 8.0 |
| 2001-02 | 28.5 | 30.9 | 16.6 | 22.6 | 22.7 | 22.1 | 15.9 | 17.4 | 9.0 |
| 2002-03 | 28.8 | 31.1 | 18.1 | 19.6 | 17.4 | 27.3 | 15.8 | 17.4 | 9.5 |
| 2003-04 | 27.8 | 29.3 | 21.8 | 21.2 | 19.0 | 28.0 | 15.5 | 16.7 | 11.6 |
| 2004-05 | 28.0 | 29.6 | 21.9 | 22.0 | 19.1 | 35.5 | 16.2 | 16.9 | 13.5 |
| 2005-06 | 32.3 | 34.1 | 26.0 | 22.5 | 19.8 | 31.9 | 18.7 | 20.0 | 14.7 |
| 2006-07 | 31.8 | 30.6 | 35.0 | 34.9 | 26.3 | 60.2 | 18.5 | 18.1 | 19.5 |
| 2007-08 | 33.4 | 31.9 | 38.1 | 29.3 | 26.7 | 37.0 | 19.5 | 18.9 | 21.2 |
| 2008-09 | 31.2 | 32.6 | 27.5 | 38.0 | 38.6 | 36.5 | 17.4 | 18.9 | 13.9 |
| 2009-10 | 34.1 | 36.9 | 24.7 | 35.4 | 36.4 | 32.1 | 19.2 | 21.5 | 12.8 |
| 2010-11 | 34.6 | 38.0 | 24.6 | 40.3 | 38.2 | 45.9 | 20.0 | 22.7 | 13.1 |
| 2011-12 | 36.7 | 36.7 | 36.9 | 46.7 | 42.4 | 59.7 | 22.5 | 23.2 | 20.8 |
Note: RM&C refers to Raw materials and components, and SS refers to stores and spares
Source: Author’s estimates based on data extracted from related RBI studies published in RBI Bulletin, Various Issues
Table 2. Capital goods imported as percentage of spending on purchase of capital goods
| Year | All companies | Indian companies | FDI companies |
| 1993-94 | 14.0 | 12.9 | 25.5 |
| 1994-95 | 18.6 | 17.9 | 26.7 |
| 1995-96 | 23.6 | 23.2 | 27.6 |
| 1996-97 | 30.9 | 25.6 | 54.8 |
| 1997-98 | 22.5 | 21.6 | 28.9 |
| 1998-99 | 30.3 | 31.3 | 24.7 |
| 1999-00 | 17.0 | 14.7 | 36.4 |
| 2000-01 | 24.4 | 21.5 | 41.2 |
| 2001-02 | 22.9 | 22.2 | 27.8 |
| 2002-03 | 23.7 | 23.9 | 22.7 |
| 2003-04 | 54.7 | 58.1 | 43.9 |
| 2004-05 | 37.6 | 33.7 | 64.0 |
| 2005-06 | 32.8 | 31.4 | 39.0 |
| 2006-07 | 30.9 | 28.1 | 36.3 |
| 2007-08 | 28.8 | 23.1 | 44.5 |
| 2008-09 | 32.2 | 31.8 | 33.1 |
| 2009-10 | 36.4 | 29.2 | 58.4 |
| 2010-11 | 33.7 | 33.5 | 33.9 |
| 2011-12 | 34.8 | 32.3 | 39.9 |
Source: Same as Table 1.
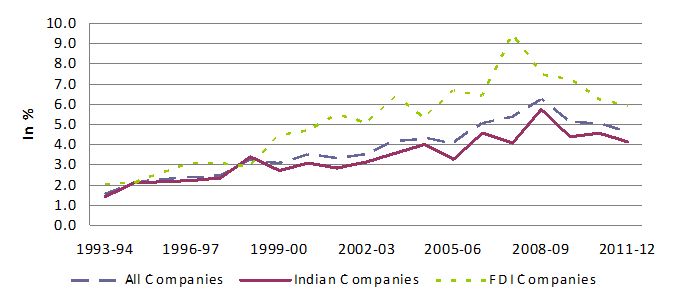
Moreover, non-import spending showed a steady rise from 1.5% of sales in 1993-94 to 6.3% in 2008-09, which declined to 4.7% in 2011-12 (Figure 2). Non-import spending as a percentage of sales of FDI companies is observed to be higher than that of Indian companies. It should be noted that the major non-import spending such as technical fees, royalties and dividends are direct costs of technology and foreign equity participation. Thus, higher non-import spending of FDI companies is indicative of the nature of their engagement with the domestic country.
Figure 2. Non-import spending, as % of sales

Net earnings in foreign currencies
I further examine the overall balance in external transactions of the corporate sector by analysing net earnings in foreign currencies, that is, total earnings in foreign currencies minus total expenditure in foreign currencies. In Table 3, this has been expressed as percentage of sales (value of outputs) and percentage of gross value added (GVA) (or the income of the sector).
Table 3. Trend in net earnings in foreign currencies
 Source: Same as Table 1.
 |
Year |
As % of sales |
As % of Gross Value Added |
||||
| All Cos. | Indian Cos. | FDI Cos. | All Cos. | Indian Cos. | FDI Cos. | |
| 1993-94 | 0.3 | -0.7 | 3.5 | 1.1 | -3.1 | 14.3 |
| 1994-95 | -2.3 | -2.5 | -0.8 | -9.4 | -10.7 | -3.3 |
| 1995-96 | -4.5 | -4.6 | -4.1 | -18.6 | -19.1 | -16.4 |
| 1996-97 | -3.6 | -2.6 | -8.0 | -15.2 | -11.4 | -31.6 |
| 1997-98 | -3.5 | -4.1 | -0.6 | -14.9 | -17.6 | -2.4 |
| 1998-99 | -3.1 | -3.3 | -2.1 | -13.0 | -14.2 | -8.4 |
| 1999-00 | -2.4 | -2.6 | -2.0 | -10.4 | -11.1 | -8.0 |
| 2000-01 | -0.3 | -0.9 | 1.3 | -1.4 | -3.9 | 5.2 |
| 2001-02 | -3.8 | -4.8 | 0.7 | -17.4 | -22.8 | 2.7 |
| 2002-03 | -1.5 | -2.9 | 4.0 | -6.6 | -13.4 | 14.1 |
| 2003-04 | -1.3 | -1.5 | -0.8 | -5.6 | -6.6 | -2.9 |
| 2004-05 | -2.1 | -1.5 | -4.6 | -9.1 | -6.4 | -19.8 |
| 2005-06 | -4.0 | -3.8 | -4.9 | -17.3 | -16.5 | -20.1 |
| 2006-07 | -3.4 | -1.6 | -8.3 | -13.7 | -6.3 | -32.6 |
| 2007-08 | -4.6 | -1.8 | -13.1 | -18.7 | -7.4 | -52.6 |
| 2008-09 | -3.2 | -2.4 | -4.9 | -13.3 | -9.8 | -21.9 |
| 2009-10 | -6.2 | -6.6 | -5.1 | -25.1 | -27.7 | -18.6 |
| 2010-11 | -5.2 | -4.9 | -5.9 | -21.7 | -20.8 | -23.6 |
| 2011-12 | -4.8 | -3.3 | -8.3 | -22.1 | -15.6 | -37.3 |
As shown in Table 3, not only does the corporate sector have a deficit in foreign exchange (earnings in foreign exchange being lower than spending in foreign exchange), but this deficit has been widening as a percentage of GVA and sales. Indian companies report negative net earnings in foreign currencies throughout. FDI companies too had deficit except in the first few years of 1990s and from 2000-01 to 2002-03. As a percentage of their sales and GVA, foreign earnings deficit of FDI companies has remained considerably higher than that of their Indian counterparts since 2004-05. This shows that the overall earnings of corporate in foreign currencies fall considerably short of their spending in foreign currencies. The outcome of India’s corporate sector’s engagement with rest of the world, arising from trade liberalisation, has not thus favoured the country’s BoP.
‘Make in India’ should focus on domestic inputs and technology
Corporates, including both Indian and FDI companies, are increasingly relying on imported inputs. Comparatively better export intensity of Indian companies since 1998-99 indicates that Indian companies have increasingly become more focused on the global market, while FDI companies have become more focused on the Indian market. Corporates report a trade deficit (difference between exports and imports), which has widened in the recent years, accounting for about one fifth of the income of the sector - a sizeable outflow of foreign exchange.
For the country as a whole, the overall current account deficit was 1.6% of gross domestic product (GDP), at market price, in 1992-93 and 4.2% in 2011-12, the highest in the last two decades5. The observed rise in the foreign earnings deficit of the corporate sector would have undeniably contributed to the rising current account deficit.
Given that ‘Make in India’ seeks to provide a fillip to domestic manufacturing, an important shortcoming is the lack of emphasis on procurement of domestically-produced inputs. Based on the results discussed above, it cannot be denied that corporates will view the domestic market as a substitute for the global market, particularly when the domestic economy reports steady growth. As much as the government attempts to invigorate corporate investment (both domestic and foreign) by easing norms, a certain level of export commitment, if solicited, will facilitate more inflow of foreign exchange. It is also necessary to step up domestic technological capabilities so as to reduce reliance on imported technology. Such measures, if appropriately designed and implemented, will reduce the outflow of foreign exchange arising out of corporates’ external transactions.
Notes:
- Balance of Payments (BoP) is a statement of a country´s net financial transactions with other countries. This is normally broken down into the current account, which includes the visible balance of trade (difference between exports and imports of goods) and the invisible trade balance (payments and receipts for services such as shipping, banking and tourism); and the capital account, which measures the inflow and outflow of short-term and long-term capital (such as direct investment, income from securities, property etc.). In India, BoP is maintained by Reserve Bank of India (RBI). BoP surplus is the amount by which the money coming into a country is more than the money going out in a particular period of time.
- RBI classifies a company under the FDI companies’ category if 10% or more equity holding is by foreign investor(s). The same definition is followed in computing Balance of Payments (RBI Monthly Bulletin, December 2012, pp. 2389).
- While this has been the case throughout since 1993-94, RBI has, in its latest study for 2011-12, included an additional 51 FDI companies, not included in their regular studies of Public and Private Limited companies for that year (RBI Press Release dated 26 December 2013).
- This refers to stocks of stores and spares used by a company for maintenance of its plant, machinery, buildings, transport equipment etc.
- This is based on data from India Times Series of the Economic and Political Weekly Research Foundation. GDP data is as per 2004-05 price series.
Further Reading
- Rajakumar, J Dennis (2014), “Foreign Exchange Spending and Earning of Corporates in India”, Economic and Political Weekly, Vol. XLIX, No. 45, pp. 75-78.
- Rajakumar, J Dennis (2011), “Size and Growth of Private of Corporate Sector in Indian Manufacturing”, Economic and Political Weekly, Vol. XLVI, No. 18, pp. 95-101.
- Reserve Bank of India, RBI Bulletin, Various issues.

Comments will be held for moderation. Your contact information will not be made public.