

 07 June, 2017


There is anecdotal evidence that banks in India have been extending credit to highly distressed firms. By delaying recognition of bad loans, banks may improve their own profitability in the short run, but in the long run, this has only exacerbated the non-performing asset crisis in the banking sector. This column provides preliminary empirical evidence that banks have indeed been throwing good money after bad.
Terms such as 'zombie lending' and 'evergreening' were used in the context of the Japanese banking crisis in the 1990s. These refer to banks allocating their lending portfolios to financially unhealthy firms which are least likely to use this credit productively or pay it back. Presumably banks do this to roll over the loans to the distressed borrowers, and avoid write-offs and consequent losses. As a result of such lending, the supply of bank credit to the relatively healthy and productive firms gets reduced. Evidence of this kind of financing strategy adopted by banks has been documented for Japan (Caballero et al. 2008), Italy (Albertazzi and Marchetti 2011) and Portugal (Iyer et al. 2014) among other countries.
Bank lending to stressed firms is not bad per se. Extending credit to firms that face temporary financial stress may be critical for keeping them operational and reviving them. However, lending to firms that are highly distressed and have little or no ability to repay these loans is tantamount to throwing good money after bad. It is detrimental to the economy, conceals the extent of impairment in banks' balance sheets and delays resolution of firms' distress. Such delays may increase the eventual losses faced by the banks.
In India, for more than three decades, the legal mechanisms for resolving corporate distress have not been working well. Banks being the primary source of external credit for firms, corporate distress makes its way to the banks' balance sheets in the form of non-performing assets (NPAs). In 2001 the Reserve Bank of India (RBI) initiated the Corporate Debt Restructuring (CDR) scheme to facilitate out-of-court work-outs between distressed firms and their lenders, largely banks. The stated objective of CDR was to alleviate distress in the economically viable firms, and through this, control the rising NPAs on the banks' balance sheets. In the wake of the global financial crisis of 2008, RBI provided regulatory forbearance to the scheme, permitting banks to hold lower provisions against the loans given to CDR firms. This made CDR a popular tool with banks, and it remained so till 2015 when the forbearance was removed. 530 firms with an aggregate debt of Rs. 4.03 trillion received CDR between 2001 and 2015. 65% of these firms received CDR between 2009 and 2014 and accounted for 80% of the aggregate corporate debt (CDR Cell data).
In developed countries firm distress is identifiable through market mechanisms or bankruptcy filings. That is not the case in India. Reference to CDR explicitly identifies firms' financial distress, and gives us an opportunity to study the patterns of bank financing to distressed firms. We use this as an event to analyse the financial health of firms before and after they received CDR, and document the evolution of bank lending to these firms.
Data and methodology
For our analysis we use data from two sources: from the CDR Cell on firms referred to and approved for CDR, and from CMIE (Centre for Monitoring Indian Economy) Prowess on firm financials. We focus on the 2008-2012 period which has been the most active period for the CDR mechanism. The start of this period coincides with the global financial crisis. The end of the period is dictated by availability of CDR data. 199 companies were referred to CDR during this period of which 174 received a package. We focus on the firms that received CDR.
For these firms, we obtain data on six financial variables. Three of these pertain to the financial health of a firm. These are interest coverage ratio (ICR), cash profit (CP), and net-worth (NW). The other three pertain to the firms' capital structure. These are total liabilities (TL), borrowing, and bank borrowing.
We obtain data on these variables for a five-year period, two years prior to and two years post the firm's CDR reference year, and the reference year itself. For every firm, we harmonise the timescale by denoting the CDR reference year as time t, the two years prior as t-1 and t-2 and the two years post as t+1 and t+2. For example, for a firm referred to CDR in 2008, the five-year period is 2006 to 2010, whereas for a firm referred in 2012, the period is 2010 to 2014. This approach has two advantages. First, it allows comparison across firms that received CDR over different years. Second, to some extent, it controls for the impact of other changes that may have affected bank borrowing patterns during the sample period.
We create a balanced panel by retaining firms for which all six financial variables are available over the five-year period t-2 to t+2. This gives us a final sample of 114 firms. Table 1 shows the distribution of the 114 firms by their CDR reference year.
Table 1. Reference year wise distribution of firms and bank borrowing
| CDR reference year | Number of firms | Aggregate bank borrowing in CDR reference year (Rs. bn.) |
|---|---|---|
| 2008 | 15 | 32.1 |
| 2009 | 24 | 106 |
| 2010 | 13 | 30.2 |
| 2011 | 19 | 147.2 |
| 2012 | 43 | 311.7 |
| Total | 114 | 627.2 |
We then use ICR, CP and NW to assess the financial health of these 114 firms in each of the five periods from t-2 to t+2. A firm with ICR < 1 does not have capacity to repay its interest. A firm with CP < 0 is loss-making and a firm with NW < 0 has liabilities greater than assets. Table 2 shows the scheme that we use to assign scores ranging from 0 to 3 to all the 114 firms in our sample.
Table 2. Scheme of scoring
| Scores | ICR | CP | NW | Distress level |
|---|---|---|---|---|
| Score 0 | >1 | >0 | >0 | Healthy |
| Score 1 | <1 | >0 | >0 | Incipient distress |
| Score 2 | <1 | <0 | >0 | Distressed |
| Score 3 | <1 | <0 | <0 | Highly distressed |
Results
We summarise the main results of our analysis in four points below.
(i) While the CDR scheme was not confined to large firms, the first quartile firms in our sample accounted for 69% of the bank borrowing in the CDR reference year as shown in Table 1.
Table 3. Quartile wise distribution of bank borrowing
| Quartiles (by bank borrowing) | Number of Firms | Fraction of bank borrowing in CDR reference year (%) | Average bank borrowing per firm in CDR reference year (Rs. bn.) |
|---|---|---|---|
| Q1 | 29 | 69% | 14.8 |
| Q2 | 29 | 18% | 3.9 |
| Q3 | 28 | 9% | 2.1 |
| Q4 | 28 | 4% | 0.9 |
| Total | 114 | 100% | 5.5 |
(ii) The level of financial distress of the firms did not get alleviated in t+1 and t+2. Figure 1 shows the evolution of financial distress for the Q1 firms in the post-CDR period in our sample. Next to each score, we have mentioned the number of firms belonging to that score category in the relevant years. More than 80% of the firms in the score 0 and score 1 category worsened to score 2 and score 3. More than 50% of the firms in the score 2 category worsened to score 3. The financial health of only 3 out of 16 firms in the score 2 and score 3 categories improved by t+2.
Figure 1: Evolution of Stress: Q1 firms
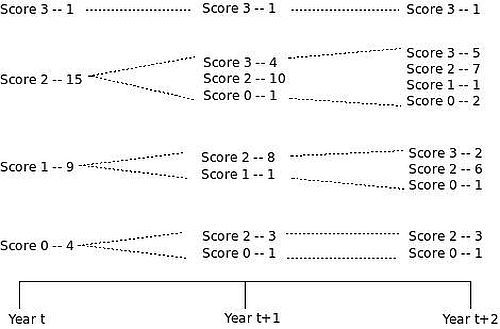
Table 4. Firm distress and bank borrowing in the CDR and post-CDR years
| Year t | Year t+1 | Year t+2 | |
|---|---|---|---|
| Q1 firms | |||
| Number of firms with score 2 and score 3 (% of total firms) | 55.2 | 89.7 | 82.8 |
| Bank borrowing of score 2 and score 3 firms (% of total bank borrowing) | 60.1 | 83.8 | 77 |
| Average bank borrowing per firm (Rs. bn) | 14.8 | 17.1 | 17.6 |
| Full sample | |||
| Number of firms with score 2 and score 3 (% of total firms) | 67.5 | 72.8 | 63.2 |
| Bank borrowing of score 2 and score 3 firms (% of total bank borrowing) | 64.3 | 80.3 | 71.4 |
|
Average bank borrowing per firm (Rs. bn) |
5.5 | 6.3 | 6.2 |
(iii) Banks continued to lend to the firms despite the levels of firm distress going up. For the Q1 firms as well as for the full sample, more than 70% of the bank borrowing was accounted for by the distressed and highly distressed firms in t+2. Figure 1 and Table 4 together show that while banks continued to extend financing to the distressed firms, the level of firm distress did not go down and remained high in t to t+2 period. We find a similar pattern when we extend our analysis to t+3. This suggests that the nature of financial distress in these CDR firms was not temporary and many of them may have been economically unviable.
(iv) The leverage of the CDR firms increased in the post-CDR period as shown in Table 5. The share of bank borrowing in total borrowing of these firms also remained high, at around 64%.
Table 5. Leverage of firms in the CDR and post-CDR years
| Year t | Year t+1 | Year t+2 | |
|---|---|---|---|
| Q1 firms | |||
| Average Leverage (TB/TL) (%) | 57.4 | 61.9 | 65.1 |
| Full sample | |||
| Average Leverage (TB/TL) (%) | 57.9 | 62.7 | 65.9 |
Conclusion
In this column, we show preliminary evidence that during 2008-2014, banks in India continued to lend to highly distressed firms, a large fraction of whom may have been economically unviable. In the post-CDR period, the level of firm distress remained elevated while the leverage of these firms increased. This is consistent with the findings of Jain et al. (2015) who show that in the post-CDR period, CDR firms exhibited a lower profitability than a matched sample of non-CDR firms. Together these studies imply that the resolution of firm distress may not have been the main purpose of CDR. Banks - incentivised by RBI's regulatory forbearance - were using the CDR mechanism to prevent the loans to these firms from becoming NPAs.
Ideally, banks should have followed an 'adjustment strategy' fully providing for NPAs coming from the highly distressed firms (those with scores 2 and 3 in our sample), and then encouraging them to de-lever. This may have reduced bank profits early on, but would have subsequently led to higher recoveries, with firms getting restructured. Instead, banks chose the 'financing strategy' which further increased the leverage of distressed firms, and aggravated the stress in the balance sheets of the firms as well as the banks. We are seeing the results of this twin balance sheet crisis (Economic Survey, 2016-17) in the corporate and banking sectors today.
The finding that banks have been throwing good money after bad is particularly important in the backdrop of the recent Banking Regulation (Amendment) Ordinance, 2017. The Ordinance empowers the RBI to direct banks to initiate restructuring mechanisms against defaulting firms. In doing so, it is critical that a repeat of the 'financing strategy' does not take place. An effective restructuring mechanism has three components. First, there needs to be an independent assessment of firm viability before undertaking any restructuring, let alone extending additional credit. This failed in CDR where banks who were affected by the CDR outcomes were also the decision-makers. Second, regulatory forbearance vitiates the incentives for viability assessment which is a commercial decision, and should not be granted. Third, the presence of a formal insolvency process imposes discipline on informal restructuring mechanisms. Lenders choose to informally restructure only those firms where they are likely to recover more than in the formal process, and borrowers cooperate with lenders or face liquidation as part of formal bankruptcy. In India today, one out of these three is in place in the form of the Insolvency and Bankruptcy Code, 2016. To ensure the effectiveness of any restructuring mechanism banks may now be directed by the RBI to pursue, the other two elements are crucial.
Further Reading
- Albertazzi, U and D Marchetti (2011), 'Credit Crunch, Flight to Quality and Evergreening: An Analysis of Bank-Firm Relationships After Lehman', Bank of Italy mimeo. Available here.
- Caballero, Ricardo J, Takeo Hoshi and Anil K Kashyap (2008), "Zombie Lending and Depressed Restructuring in Japan", The American Economic Review, 98(5):1943-1977. Available here.
- Jain, S, K Singh and S Thomas (2015), 'Evaluating the impact of the Corporate Debt Restructuring scheme', Presented at the 6th Emerging Market Finance Conference 2015.
- Iyer, Rajkamal, Jose-Luis Peydro, Samuel da-Rocha-Lopes and Antoinette Schoar (2014), "Interbank Liquidity Crunch and the Firm Credit Crunch: Evidence from the 2007–2009 Crisis", Review of Financial Studies, 27(1):347-372.

Comments will be held for moderation. Your contact information will not be made public.