

 18 March, 2021


The immediate adverse impact of the Covid-19 pandemic and associated lockdown was visibly greater for migrant workers and their households, whose ability to access government schemes in their villages of origin was uncertain. Analysing data from a survey in rural Bihar in June-July 2020, Sarin et al. find that household with migrants were more likely to cut down on food and suffer from mental health issues – even as they reported higher incomes than non-migrant households.
The Covid-19-induced lockdown, which was first imposed in India in March 2020, has put to test several government-run social protection schemes, and their role in alleviating the distress of vulnerable populations. The immediate adverse impact of the crisis was visibly greater for migrant workers and their households, whose ability to access government schemes in their villages of origin was uncertain.
We use data on 3,093 households across 12 districts1 in Bihar, collected by RCRC (Rapid Rural Community Response to COVID-19)2 in June-July 2020 (first two months of easing of the nationwide lockdown), to understand the experience of the state’s vulnerable populations, and how key government schemes performed in the face of unprecedented adversity.
Overall, the households in the study sample are predominantly disadvantaged, with 75% of households having annual income less than Rs. 60,000. About 11% of the households belong to General Caste, 60% to Other Backward Classes (OBC), 23% to Scheduled Castes (SC), and 6% to Scheduled Tribes (ST). The sample has a representation of 12% Muslims, 73% of which are OBC and 27% are General Caste). As compared to the averages for Bihar state in the All-India Census (2011), SC, ST, and Muslims have been slightly oversampled in the study. Around 39% of the households surveyed have migrant workers. With net migration (incoming minus outgoing migrants) of -1.7 million (Census, 2011), Bihar was only second to Uttar Pradesh in terms of residents migrating to other states.
Access to government schemes
We review how key government schemes – the Mahatma Gandhi National Rural Employment Guarantee Act (MNREGA),3 public distribution system (PDS), and the Pradhan Mantri Jan Dhan Yojana (PMJDY)4 – performed during the survey period across households belonging to different income groups.
Table 1. Households’ food security and access to government schemes, by income group
|
Annual household Income (in Rs.) |
Households that cut down on food items |
Received free ration three or more times |
Member of household worked under MNREGA |
Household has women with Jan Dhan account |
Received all three Jan Dhan transfers (among those with accounts) |
Sample size |
|
Less than 30,000 |
58% |
46% |
11% |
65% |
56% |
1,093 |
|
30,000 to 60,000 |
50% |
55% |
12% |
75% |
50% |
1,277 |
|
More than 60,000 |
47% |
54% |
2% |
64% |
57% |
723 |
|
Overall |
52% |
51% |
9% |
69% |
54% |
3,093 |
The MNREGA, which has been an important part of the central government’s response to the Covid-19 crisis, has been seen with cautionary hope since the lockdown was imposed. The take-up of the scheme during the survey months has been the highest since the beginning of the programme (Sharma 2020). Official MNREGA data show a surge of 1.1 million in the number of job cards issued in Bihar between April and August 2020 (MN and Ray 2020). Disappointingly, issues of delayed payments, not enough work being approved, and wages being lower than state minimum wages (Aggarwal and Paikra 2020), have persisted and have been raised since early April 2020 (Kumar 2020). Perhaps reflective of this, only 9% households in our sample had a member of the household who worked under MNREGA. Poorer households were more likely to report working under MNREGA (11% in the lowest income group, as compared to 2% in the highest income group), indicating rural distress and the scheme’s potential utility for social protection.
The situation was disturbing when it came to access to sufficient food, with 52% households reporting cutting down on food. This was strongly associated with annual income levels of the household: those with lower incomes were more likely to report cutting down on food (Table 1).
Turning to the PDS, which has come to be looked at as a safety net for “even those ‘better off’” after the lockdown, 51% of the households in our sample reported having received free ration more than three times since April 2020. However, access for those who were slightly better-off (earning above Rs. 30,000 per year) was higher (~5%) as compared to 46% in the lowest income bracket.
The transfer of Rs. 500, three times, to Jan Dhan accounts, has been the most visible policy response in the face of the pandemic. Somanchi (2020) estimates exclusion of rural households from the cash transfer to be around 46% nationally. In our sample, 69% households reportedly had a woman Jan Dhan account-holder and among those, 54% reported receiving all three transfers. While those in the income group of Rs. 30,000 to Rs. 60,000 annually are most likely to have an account (75% of such households), these households were also least likely to have received all three transfers (50%).
State of ‘migrant households’
What was the status of food security, mental health, and access to schemes among households with migrants (these constitute 39% of our sample and are hereafter referred to as ‘migrant households’) as compared to ‘non-migrant households’?
Table 2. Income profile of migrant households in the study sample
|
Annual household income (in Rs.) |
Households with migrant(s) |
Households without migrant |
|
Less than 30,000 |
33% |
67% |
|
30,000 to 60,000 |
35% |
65% |
|
More than 60,000 |
57% |
43% |
|
Overall |
39% |
61% |
The migration in our sample is reported to be more ‘push-based’ and likely because of financial hardship and lack of earning opportunities near home (67% of migrant households report migrating for these reasons), rather than ‘pull-based’ or aspirational. Even as migrant households reported higher incomes (Table 2), they were more likely to report cutting down on food items: 59% of such households cut down on food, 12 percentage points more than non-migrant households (Table 3). Migrant households were also more likely to report facing mental health issues in the form of sleep deprivation (39%), being anxious/worried (83%), and feeling irritated/angry (43%) (Table 4).
Fifty-three per cent of migrant households received PDS rations at least three times since the beginning of the lockdown, and 10% worked under MNREGA. These figures were similar to those for non-migrants. However, a higher percentage of migrant households had a female Jan Dhan account-holder (75% as opposed to 64% for non-migrant households) and also reported a higher percentage of account-holders receiving all three transfers of Rs. 500.
When we restrict the sample to the poorest households, the trends for migrant and non-migrant households are largely similar in terms of PDS rations and PMJDY. However, migrant households in this group were more likely to work under MNREGA (17%) relative to non-migrant households (8%).
Table 3. Access to government schemes for migrant and non-migrant households
|
Households that cut down on food items |
Received free ration three or more times |
Member of household worked under MNREGA |
Household has women with Jan Dhan account |
Received all three Jan Dhan transfers (among those with accounts) |
Sample size |
|
|
Households with migrant(s) |
59% |
53% |
10% |
75% |
57% |
1,221 |
|
Households without migrant |
47% |
50% |
9% |
64% |
51% |
1,872 |
Table 4 Mental health of migrant and non-migrant households
|
Households that report sleep deprivation |
Households that report anxiety/worry |
Households that report irritation/ anger |
Sample size |
|
|
Households with migrant(s) |
39% |
83% |
43% |
1,221 |
|
Households without migrant |
26% |
75% |
35% |
1,872 |
Note: In our sample, 81% of the respondents were head of households.
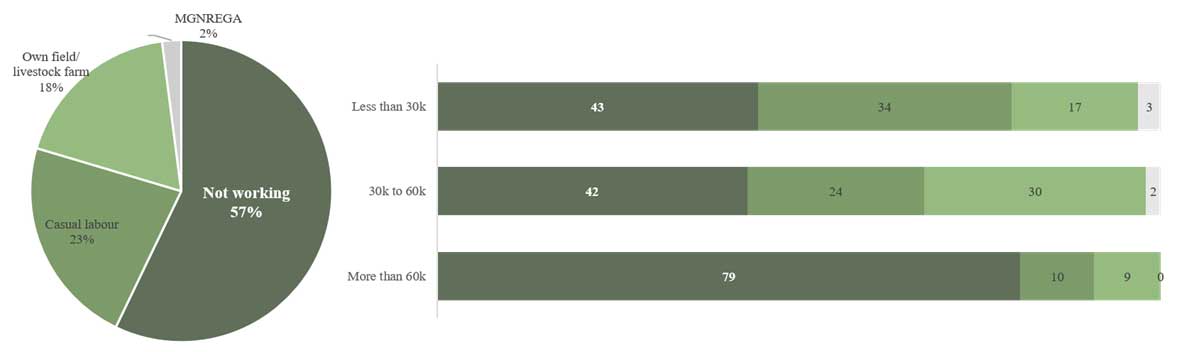
In our sample, 79% of the migrant households had migrating member(s) return at the time of the survey. Overall, 56% of these households were not involved in any economic activity, 22% worked as casual labour, and 18% were working on their own farm/livestock. Those who were better-off were more likely to stay out of work: 79% of those in the highest income bracket did not work (Figure 1).
Figure 1. Employment status of migrant households after returning to villages
How did ‘aspirational districts’ fare?
Turning our attention to those residing in ‘aspirational districts’,5 we ask how they have fared in terms of food security and access to schemes/programmes as compared to others? Are there some districts that do distinctly better than others, perhaps reflecting better governance?
We find that households residing in aspirational districts (Araria, Katihar, Muzaffarpur, and Nawada) were much more vulnerable than households residing in non-aspirational districts. Of the households living in aspirational districts, 56% reported cutting down on food, as opposed to 45% in non-aspirational districts. However, the reach of government programmes was considerably better in aspirational districts for PDS, MNREGA, and Jan Dhan account-holding and transfers (Table 5). These patterns remain even when we compare the poorest households across aspirational and non-aspirational districts.
Table 5. Food security and government schemes in aspirational and non-aspirational districts
|
|
Household that cut down on food items |
Received |
Member |
Household |
Received |
Sample size |
|
Households inaspirational districts |
62% |
71% |
15% |
80% |
69% |
1,267 |
|
Households innon-aspirational districts |
45% |
38% |
5% |
61% |
39% |
1,826 |
Focussing on aspirational districts, it is not that one district does distinctly better than the rest in different government schemes (Table 6). For example, almost 90% of households in Nawada reported to have received free ration three or more times, but only 6% had worked under MNREGA. Muzaffarpur, which had 16% households working under MNREGA, had a much lower penetration of Jan Dhan accounts (66%) and very low reported transfers (56% of account-holders) relative to other districts. We observe similar unevenness in access to schemes even when we compare the poorest households residing in these districts.
Table 6. Does vulnerability and access vary within aspirational districts?
|
Districts |
Households that cut down on food items |
Received free ration three or more times |
Member of household worked under MNREGA |
Household has women with Jan Dhan account |
Received all three Jan Dhan transfers (among those with accounts) |
Sample Size |
|
Araria |
76% |
50% |
29% |
98% |
95% |
241 |
|
Katihar |
49% |
87% |
7% |
95% |
64% |
237 |
|
Muzaffarpur |
64% |
68% |
16% |
66% |
56% |
631 |
|
Nawada |
89% |
89% |
6% |
84% |
74% |
158 |
The overall better reach of government programmes in aspirational districts shows that these districts have indeed received more policy attention, as we might have hoped. Despite better access to government support, the fact that residents in these districts were more likely to report food shortage suggests that the response might not have been sufficient to overcome existing vulnerabilities characterising these geographies. This points to the need for sustained, long-term commitment to such areas to ensure that they become more resilient in times of crises.
The authors would like to thank Ved Arya for helpful comments on earlier drafts of the note, the organisations in Bihar who participated in the data-collection process, enumerators who collected the data, and the RCRC team for sharing the survey data for this analysis.
I4I is now on Telegram. Please click here (@Ideas4India) to subscribe to our channel for quick updates on our content
Notes:
- The 12 districts surveyed were Araria, East Champaran, Kaimur, Katihar, Kishanganj, Muzaffarpur, Nawada, Patna, Samastipur, Saran, Siwan, and West Champaran.
- RCRC is a collective of over 50 community-based organisations that have come together to coordinate efforts to support rural populations, particularly migrants. Through the network, RCRC has conducted surveys across 12 Indian states in June-July 2020. The organisations were provided with guidance on sampling households randomly. However, given the situation, it is unlikely that all organisations were able to survey a truly random sample. Further, in a situation of crisis, it is likely that organisations were able to survey more households that they had some prior engagement with. These caveats imply that the sample may not necessarily be statistically representative of the state’s vulnerable populations, and the findings can be seen as reflecting the experiences of the surveyed households.
- MNREGA guarantees 100 days of wage-employment in a year to a rural household whose adult members are willing to do unskilled manual work at the prescribed minimum wage.
- PMJDY is a financial inclusion programme of the Government of India, which aims to expand access to financial services such as bank accounts, remittances, credit, insurance, and pensions among Indian citizens.
- Aspirational districts are those districts “which have shown relatively less progress across different sectors and thus require focused policy attention” (NITI Aayog, 2018).
Further Reading
- Aggarwal, A and VK Paikra (2020), ‘Why are MNREGA wages so low?’, Ideas for India, 5 October.
- Kumar, S (2020), ‘In Bihar, Jobless, Penniless MGNREGA Workers hit Hard by Pandemic Lockdown’, NewsClick, 21 April.
- Khera, R and A Somanchi (2020), ‘A review of the coverage of PDS’, Ideas for India, 19 August.
- MN, P, and U.K. Ray (2020), ‘Bihar’s migrant workers are returning to cities as rural employment schemes fall short’, Scroll, 20 October.
- NITI Aayog (2018), ‘Aspirational Districts, Unlocking Potentials’, Government of India.
- Sharma, H (2020), ‘Explained: UP, Bihar, Bengal see biggest jump in new NREGA job cards’, Indian Express, 13 September.
- Somanchi, A (2020), ‘Covid-19 relief: Are women Jan Dhan accounts the right choice for cash transfers?’, Ideas for India, 22 May.

Comments will be held for moderation. Your contact information will not be made public.