

 28 September, 2018


Intergenerational mobility is important for fairness and economic efficiency in a society. This article uses data from a new global study spanning five decades to show that average relative mobility is lower in developing economies, with no sign of the gap with developed countries getting smaller. Also, income mobility in several developing economies is much lower than their levels of educational mobility would lead us to expect. Labour market deficiencies appear to be contributing to this gap between mobility in education and income.
A society with high (relative) intergenerational mobility is one where an individual’s well-being, relative to others of his or her generation, is less dependent on the socioeconomic status of his or her parents. Arguably, there are two main reasons why higher relative mobility in a society should be a goal for public policy: fairness and economic efficiency. When mobility is low, one’s chances of success are largely preordained by the accident of birth, which goes against a basic notion of fairness in most societies. Also, low mobility leads to unrealised human potential and misallocation of resources, as talented individuals from disadvantaged families are excluded from opportunities that favour those born in greater privilege rather than those with the greatest potential. Reducing such inefficiency is likely to be good for economic growth. And since the waste of human potential is more likely at the bottom of the income distribution, policies promoting higher relative mobility are likely to promote growth that is more inclusive in nature.
Chetty et al. (2014) estimate intergenerational mobility for the US down to highly disaggregated geographic areas (commuting zones) and find that it varies considerably. In some parts of the country, mobility (or equality of opportunity) is on par with some of the most mobile countries in Europe, while in other parts, children struggle to escape poverty when born into it. They also find that areas with relatively high rates of mobility tend to be ones that are less residentially segregated (that is, households from different socioeconomic backgrounds and different races reside in the same neighbourhoods) and have lower inequality, higher quality public school systems, stronger social networks, and stronger family structures. The empirical observation that more equal societies tend to be more mobile is also known as the Great Gatsby curve (Corak 2013).
In other words, lower intergenerational mobility (or higher inequality of opportunity) tends to be concentrated in the lagging areas of the US, which constrains the prospects for convergence. What would a global map of mobility look like? If the geographic patterns observed in the US are also observed across countries, then the least mobile countries are more likely to be found in the developing world. If there is indeed a gap in the equality of opportunity between the developing and the developed world, has that gap been closing over time?
These questions are at the heart of our new global study (Narayan et al. 2018). The Global Database on Intergenerational Mobility (GDIM), compiled for this study, provides estimates of intergenerational mobility – both relative and absolute – for 148 economies representing around 96% of the world’s population born in the 1980s. For 111 economies, or 87% of the world’s population, estimates of mobility span five decades, from those born in the 1940s to those born in the 1980s. The 1980s cohort represent the youngest generation of adults to have completed their education at the time of data collection. We focus primarily on mobility in education, since education is a key aspect of economic well-being and educational mobility has a strong association with income mobility. And crucially, intergenerational data on education is much more widely available than that on income. We also compile estimates of relative income mobility – complementing comparable estimates from other sources with our own estimates – for 75 economies, to provide a partial picture of income mobility globally and examine the relationship between education and income mobility.
Our primary measure of relative intergenerational mobility is the regression coefficient1 from a regression of an individual’s years of schooling on the years of schooling of his/her most educated parent. A higher coefficient indicates greater persistence, and lower mobility. Alternative measures considered include the correlation coefficient2 between individual and parental years of schooling, as well as selected transition probabilities (more on this below). The trends and patterns of relative mobility using the correlation coefficient are found to be broadly similar to those with the primary measure (see Narayan et al. 2018).
Figure 1. Relative mobility in education around the world (1980s cohort)
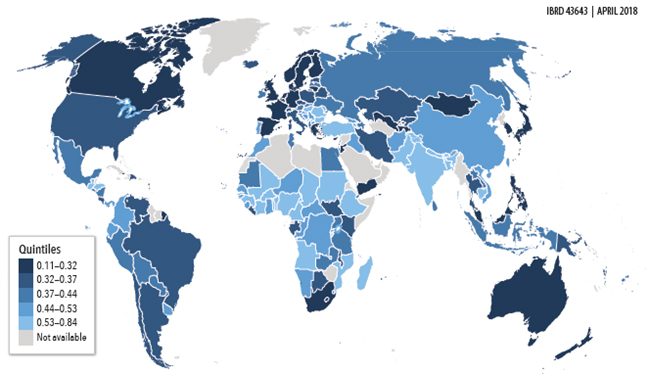 Note: Darker colour indicates higher mobility.
 We find that for large parts of the world’s population born in the 1980s, an individual’s education is still too closely tied to the education of one’s parents. For many countries in Figure 1, the regression coefficient ranges between 0.53 and 0.84, indicated by the lightest shade of blue (lighter colours indicate lower levels of mobility). Sub-Saharan Africa and South Asia stand out as regions with some of the lowest levels of mobility. Thirteen of the 15 least mobile countries are either in Africa or South Asia. Conversely, some of the highest levels of mobility are found in Western Europe, Canada, Australia, and Japan. On average, mobility is found to be considerably lower in developing (low- and middle-income) economies when compared to high-income economies (based on the latest World Bank classification). Among developing economies, East Asia and Pacific, and Middle East and North Africa are the regions with the highest average relative mobility in education, which are still well below the average for high-income economies.
Figure 2. Intergenerational persistence in education from the 1940s to the 1980s cohort
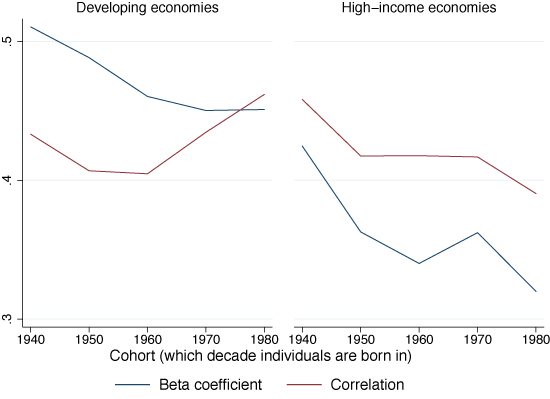 Note: Higher persistence indicates lower relative mobility
 To see whether this gap between high-income and developing economies is closing over time, average relative mobility for each group is tracked over generations born between the 1940s and 1980s. The averages are unweighted by population, which means that they represent the average mobility of economies and not of the average individual in each group. Figure 2 shows that at any point in time, average relative mobility is lower in developing economies, and there is no sign that the gap is getting smaller. If anything, the gap may be growing, particularly when the correlation coefficient is used as an alternative measure of intergenerational persistence. The lack of convergence is in large part due to the stagnation of relative mobility in the developing world. The average developing economy has shown little progress in mobility since the 1960s cohort and may have even experienced a decline.
Trends vary quite a lot across regions within the developing world. Between the 1950s and 1980s generations, large improvements in average relative mobility occurred in the East Asia and Pacific, Latin America and Caribbean, and Middle East and North Africa regions. In contrast, relative mobility in education has stagnated in sub-Saharan Africa and South Asia, the poorest regions of the world, and it has fallen in the Eastern Europe and Central Asia region, albeit from a much higher base than in other developing regions.
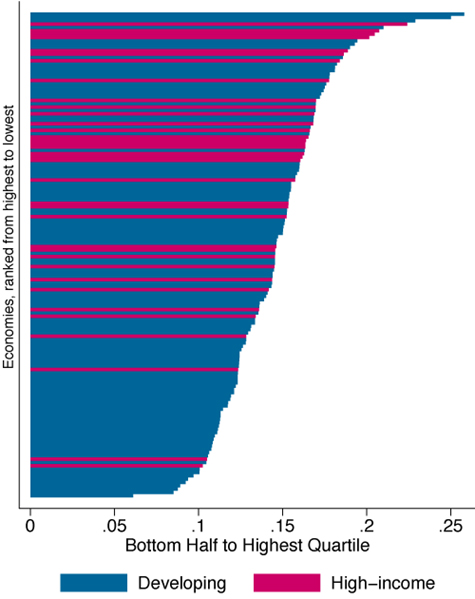
Note that intergenerational persistence (whether measured by the regression- or correlation coefficient) does not distinguish between upward and downward mobility. An example of a measure that does make that distinction is the likelihood that an individual born to parents from the bottom half is able to make it to the top quarter of his/her generation. Figure 3 plots this share (transition probability) for those born in the 1980s (developing economies are coloured blue and high-income economies are coloured red). This share would be 0.25 if one’s ability to get an education did not depend at all on how educated one’s parents were.
Mobility from the bottom to the top is found to be low everywhere – there are few economies for which this share (transition probability) exceeds 0.2 (Figure 3). Thus, for a large majority of economies in the world, one’s chances of reaching the top quarter of the ladder depends largely on where one’s parents stand on that ladder. Importantly, 46 of the 50 least upwardly mobile economies are developing economies, as seen by the concentration of blue toward the bottom of the bar chart. In the median developing economy, less than 15% of those born into the bottom half make it to the top quarter, while more than two-thirds stay in the bottom half. The US ranks as one of the four high-income economies among the 50 economies with the lowest rates of relative upward mobility. The trends are not encouraging in most parts of the world. From the 1940s to the 1980s cohorts, average upward mobility from the bottom has remained flat in high-income economies and declined in developing economies.
Figure 3. The likelihood that an individual born to parents from the bottom half reaches
While education is an important aspect of well-being, income is at least as important a yardstick for gauging the extent of economic mobility in a society. The cross-country pattern in relative income mobility – measured by a regression coefficient of an individual’s earnings on parental earnings – is found to be comparable to that of relative mobility in education, as seen from a correlation of nearly 0.5 between the two indicators. As with educational mobility, relative mobility in income is, on average, much lower in the developing world than in high-income countries. Twenty four out of the 25 economies in the bottom third by income mobility are developing economies. For several developing economies – most of which are in Africa, Latin America, and the Middle East – income mobility is much lower than what is expected for their levels of educational mobility (given the cross-country association between the two). Our study finds some evidence to suggest that labour market deficiencies are contributing to the gap between mobility in education and income.
Such findings support one of the report’s central messages for policymakers, that improving intergenerational mobility requires policies that reduce inequality of opportunities at all stages of life, from opportunities for human capital development at successive stages of childhood to levelling the playing the field in economic opportunities among adults.
This article first appeared on VoxEU: https://voxeu.org/article/intergenerational-mobility-across-world.
Notes
- Regression simply means that the value of y is a ‘function’ of x, that is, it changes with x. Regression coefficient signifies the amount y changes for a unit increase in x.
- Correlation denotes linear association between two quantitative variables. The degree of association is measured by a correlation coefficient.
Further Reading
- Chetty, Raj, Nathaniel Hendren, Patrick Kline and Emmanuel Saez (2014), “Where is the land of opportunity? The geography of intergenerational mobility in the United States”, Quarterly Journal of Economics,129(4): 1553-1623.
- Corak, Miles (2013), “Income inequality, equality of opportunity, and intergenerational mobility”, Journal of Economic Perspectives,27(3): 79-102.
- Narayan, A, R Van der Weide, A Cojocaru, C Lakner, S Redaelli, D Mahler, R Ramasubbaiah and S Thewissen (2018), Fair Progress?: Economic Mobility Across Generations Around the World, Equity and Development, World Bank, Washington DC.

Comments will be held for moderation. Your contact information will not be made public.