

 01 March, 2017


In this article, Mundle and Sikdar of NIPFP, present their estimates of the flow of subsidies through the budgets of the central government and 14 major Indian states in 1987-88 and 2011-12. The estimates show that the overall level of subsidies rela-tive to GDP has declined, as has the share of non-merit subsidies. This suggests some improvement in efficiency in this aspect of public expenditure.
We define budget subsidy as the unrecovered cost of services delivered by the gov-ernment. In the central and state government budgets in India, public expenditure is classified under administrative services, social services, and economic services. Administrative services such as defence, police, general administration, etc. are as-sumed to be pure public goods for which costs are not recoverable, by definition. Hence, the 37 administrative services in the ‘Finance Accounts’ database are not included in the subsidy estimates. The estimates cover all social and economic ser-vices. Examples of major government social services include education, health, and water supply and sanitation. Key economic services provided by the government comprise those for agriculture, industry, power, roads and other infrastructure, etc.
Thus, subsidies have been estimated as the difference between total expenditure, net of transfer payments, and receipts of all government departments providing so-cial and economic services. Transfer payments are excluded because these are unilateral transfers to augment the incomes of individuals or organisations; they are not expenditure incurred in providing any government service.
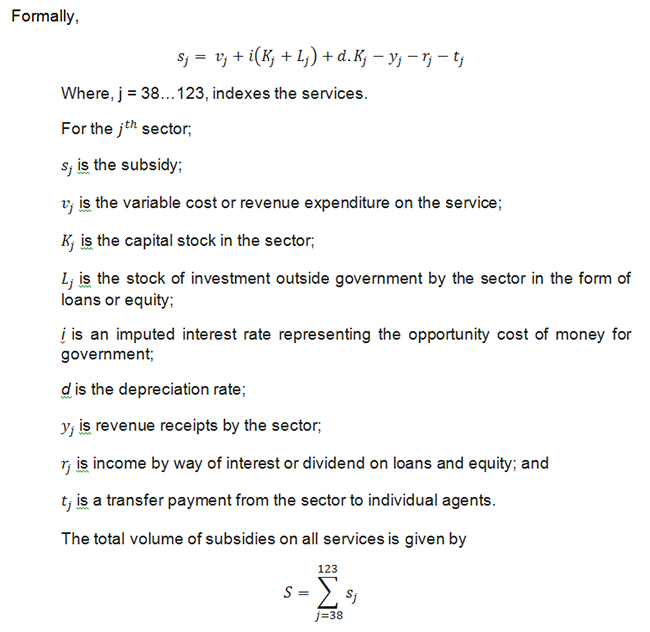
It should be emphasised that not only transfers but also other subsidy-like compo-nents - concessional interest rates, concessional prices of land or other assets, and tax concessions or exemptions (tax expenditures) - are excluded from the estimate. Thus, the concept of budget subsidy is strictly confined to the unrecovered cost of government services (goods) other than pure public services (goods).
The estimates cover 14 major states of India, including undivided Andhra Pradesh, Bihar, Madhya Pradesh, and Uttar Pradesh. On the basis of the current composition of states, altogether 18 states are covered, accounting for around 93% of India’s to-tal population. The estimates also include the flow of subsidies through the central government budget. The all-India estimate includes subsidies provided by the 18 states plus the central government.
We re-estimate subsidies for the year 1987-88, the same year for which Mundle and Rao (1991) had originally estimated subsidies following essentially the same meth-odology1. We compare these with the volume of subsidies provided in 2011-12, the latest year for which ‘Finance Accounts’ data were available when this exercise was started.2
Flow of subsidies in 1987-88 and 2011-12
The main finding reported in Table 1 below is that the volume of subsidies relative to GDP (gross domestic product) declined from 12.9% in 1987-88 to 10.6% in 2011-12. But the sectoral pattern of subsidy allocation remained broadly similar over the quarter century: well over half the subsidies are allocated to economic services at the central level, while in the states social services have continued to account for over half of all subsidies. Further details are provided below:
- For the Centre and states combined, more than half the subsidies (7.9%) was for economic services and the balance 5.1% was for social services in 1987-88. In 2011-12 a little over half the subsidies (5.8% of GDP) were still being allocated for economic services.
- Central government subsidies amounted to 4.9% of GDP in 1987-88, of which 4.2% consisted of subsidies for economic services and only 0.7% was for social services. By 2011-12, total central government subsidies had declined a little to 3.7% of GDP, most of which (2.8%) was still allocated for economic services.
- In the 14 states taken together, total subsidy on delivery of economic and social services amounted to 8% of GDP in 1987-88, of which a little over half (4.4%) was for social services. In 2011-12 the relative volume of subsidies in the states was slightly lower at 6.8% of GDP, with a little over half still being allocated to social services.
- The volume of subsidies declined relative to GSDP (gross state domestic product) in all except three of the 14 states. The three states are Maharashtra (+1%), Kar-nataka (+1.4%), and Uttar Pradesh (+2%).
- The maximum decline in the relative volume of subsidies over this period was rec-orded in Rajasthan (-3.9%), Bihar (-3.3%), and Gujarat (-2.9%).
- Despite the significant decrease in relative volume of subsidies in Bihar between 1987-88 and 2011-12, the incidence of subsidies still remained the highest (12%) in Bihar among the 14 states.
- The distribution of subsidies between merit and non-merit subsidies in 2011-12 is shown in Table 2 below. Subsidies provided for food, elementary education, sec-ondary education, health, and water supply and sanitation have been treated as merit subsidies. All other subsidies have been treated as non-merit subsidies.
- At the all-India level (Centre + states), merit subsidies (3.8% of GDP) amounted to less than 30% of total subsidy in 1987-88. However, by 2011-12 the total subsidy of 10.6% of GDP was roughly evenly divided between merit and non-merit subsi-dies at 5.6% and 5% respectively.
- At the central level, out of total subsidies amounting to 3.7% of GDP in 2011-12, about two-thirds (2.5%) was allocated to merit subsidies. For all states combined, total subsidies amounting to 6.8% of GDP was more evenly distributed between merit subsidies (3.1%) and non-merit subsidies (3.7%).
- The states giving the highest level of merit subsidies, relative to GSDP, are also the states giving high levels of non-merit subsidies. These include Bihar, Karna-taka, Uttar Pradesh, Madhya Pradesh, Orissa, and Rajasthan. All these are poor, low per capita GSDP states with the exception of Karnataka, which is an outlier.
Note
- However, the present estimates for 1987-88 are not comparable with the original Mundle-Rao esti-mates. This is mainly because the 2004-05 GDP series used here is different from that used for the earlier analysis. Also, there are small differences ( <1%) in a few absolute levels at the nine-digit level (sub-minor head) because records are not available at that level of granularity about how some am-biguous items were classified 25 years ago.
- The exercise is currently being updated to include the year 2014-15.
Table 1. Volume of budget subsidies: 1987-88 and 2011-12
| Social services | Economic services | Economic and social services | ||||||||||
| Rs. in billions | % of GSDP | Rs. in billions | % of GSDP | Rs. in billions | % of GSDP | |||||||
| State | 1987-88 | 2011-12 | 1987-88 | 2011-12 | 1987-88 | 2011-12 | 1987-88 | 2011-12 | 1987-88 | 2011-12 | 1987-88 | 2011-12 |
| (0) | (1) | (2) | (3) | (4) | (5) | (6) | (7) | (8) | (9) | (10) | (11) | (12) |
| Andhra Pradesh (including Telangana) | 13.43 | 292.06 | 5.8 | 4.4 | 9.13 | 340.26 | 4.0 | 5.1 | 22.56 | 632.32 | 9.8 | 9.5 |
| Bihar (including Jharkhand) | 11.55 | 224.06 | 7.8 | 5.9 | 11.08 | 230.39 | 7.5 | 6.1 | 22.64 | 454.46 | 15.3 | 12.0 |
| Gujarat | 10.19 | 259.22 | 5.1 | 4.3 | 9.39 | 157.13 | 4.7 | 2.6 | 19.59 | 416.36 | 9.7 | 7.0 |
| Haryana | 3.83 | 99.89 | 4.0 | 3.3 | 4.28 | 74.01 | 4.5 | 2.5 | 8.11 | 173.90 | 8.4 | 5.8 |
| Karnataka | 10.18 | 239.24 | 5.6 | 5.3 | 7.74 | 268.45 | 4.2 | 5.9 | 17.92 | 507.70 | 9.8 | 11.2 |
| Kerala | 7.91 | 143.04 | 6.0 | 4.6 | 3.78 | 76.40 | 2.9 | 2.4 | 11.70 | 219.45 | 8.8 | 7.0 |
| Madhya Pradesh (including Chhattisgarh) | 11.22 | 245.68 | 6.5 | 5.5 | 8.21 | 216.27 | 4.8 | 4.8 | 19.43 | 461.96 | 11.3 | 10.3 |
| Maharashtra | 18.24 | 491.47 | 4.2 | 4.2 | 10.02 | 383.63 | 2.3 | 3.3 | 28.27 | 875.11 | 6.5 | 7.5 |
| Orissa | 5.62 | 108.68 | 5.3 | 4.9 | 5.11 | 93.16 | 4.8 | 4.2 | 10.74 | 201.85 | 10.1 | 9.2 |
| Punjab | 5.20 | 83.44 | 4.0 | 3.3 | 6.27 | 65.13 | 4.8 | 2.5 | 11.47 | 148.58 | 8.8 | 5.8 |
| Rajasthan | 8.40 | 233.92 | 5.8 | 5.7 | 9.10 | 99.38 | 6.2 | 2.4 | 17.50 | 333.30 | 12.0 | 8.1 |
| Tamil Nadu | 11.28 | 248.61 | 4.2 | 3.7 | 12.07 | 172.27 | 4.5 | 2.6 | 23.35 | 420.88 | 8.8 | 6.3 |
| Uttar Pradesh (including Uttarakhand) | 16.74 | 435.20 | 4.4 | 5.6 | 17.00 | 404.68 | 4.4 | 5.2 | 33.75 | 839.88 | 8.8 | 10.7 |
| West Bengal | 12.09 | 244.04 | 4.4 | 4.6 | 7.90 | 107.01 | 2.9 | 2.0 | 20.00 | 351.05 | 7.3 | 6.6 |
| All states* | 145.95 | 3348.61 | 4.4 | 3.8 | 121.15 | 2688.24 | 3.7 | 3.0 | 267.11 | 6036.85 | 8.0 | 6.8 |
| Centre* | 21.66 | 818.19 | 0.7 | 0.9 | 140.04 | 2465.74 | 4.2 | 2.8 | 161.70 | 3283.93 | 4.9 | 3.7 |
| All India* | 167.61 | 4166.81 | 5.1 | 4.7 | 261.19 | 5153.97 | 7.9 | 5.8 | 428.81 | 9320.79 | 12.9 | 10.6 |
* Ratios in these rows are percentages of GDP. All states refers to the selected 14 major states
Table 2. Merit and non-merit subsidies: 1987-88 and 2011-12 (% of GSDP)
| Merit subsidies | Non-merit subsidies | Total subsidies | ||||||||||||||||||
| State | Elementary education | Secondary education | Health | Water supply, sanitation, housing, and urban development | Food | Total merit subsidies | Social sector | Economic sector | Total non-merit subsidies | |||||||||||
| 87-88 | 11-12 | 87-88 | 11-12 | 87-88 | 11-12 | 87-88 | 11-12 | 87-88 | 11-12 | 87-88 | 11-12 | 87-88 | 11-12 | 87-88 | 11-12 | 87-88 | 11-12 | 87-88 | 11-12 | |
| Andhra Pradesh (Telangana) | 1.4 | 0.9 | 0.8 | 0.8 | 1.0 | 0.8 | 0.7 | 0.6 | 0.1 | 0.1 | 3.9 | 3.1 | 2.0 | 1.3 | 3.9 | 5.0 | 5.8 | 6.3 | 9.8 | 9.5 |
| Bihar (includes Jharkhand) | 3.0 | 2.2 | 1.0 | 0.6 | 1.2 | 0.8 | 0.8 | 0.9 | 0.3 | 0.1 | 6.2 | 4.5 | 1.8 | 1.5 | 7.2 | 6.0 | 9.1 | 7.5 | 15.3 | 12.0 |
| Gujarat | 1.5 | 1.2 | 1.0 | 0.5 | 0.7 | 0.5 | 0.9 | 1.2 | 0.1 | 0.1 | 4.1 | 3.4 | 1.0 | 0.9 | 4.6 | 2.6 | 5.6 | 3.5 | 9.7 | 7.0 |
| Haryana | 0.9 | 0.8 | 0.9 | 0.6 | 0.7 | 0.4 | 0.6 | 0.7 | 0.1 | 0.1 | 3.2 | 2.7 | 0.9 | 0.8 | 4.4 | 2.3 | 5.3 | 3.2 | 8.4 | 5.8 |
| Karnataka | 1.6 | 1.3 | 0.9 | 0.8 | 1.0 | 0.7 | 0.6 | 0.8 | 0.1 | 0.3 | 4.1 | 3.9 | 1.6 | 1.7 | 4.2 | 5.6 | 5.7 | 7.3 | 9.8 | 11.2 |
| Kerala | 2.0 | 1.2 | 1.1 | 1.1 | 1.0 | 0.8 | 0.6 | 0.3 | 0.2 | 0.4 | 4.8 | 3.8 | 1.3 | 1.2 | 2.7 | 2.1 | 4.0 | 3.2 | 8.8 | 7.0 |
| Madhya Pradesh (includes Chhattisgarh) | 1.8 | 1.8 | 0.7 | 0.8 | 1.1 | 0.8 | 1.3 | 0.9 | 0.2 | 0.2 | 5.1 | 4.5 | 1.7 | 1.2 | 4.6 | 4.6 | 6.3 | 5.8 | 11.3 | 10.3 |
| Maharashtra | 1.1 | 1.2 | 0.9 | 1.0 | 0.8 | 0.4 | 0.7 | 0.7 | 0.2 | 0.1 | 3.7 | 3.4 | 0.7 | 0.9 | 2.1 | 3.2 | 2.8 | 4.1 | 6.5 | 7.5 |
| Orissa | 1.6 | 1.6 | 0.6 | 0.8 | 0.9 | 0.6 | 0.8 | 0.7 | 0.2 | 0.5 | 4.0 | 4.1 | 1.5 | 1.4 | 4.7 | 3.7 | 6.1 | 5.1 | 10.1 | 9.2 |
| Punjab | 0.8 | 0.5 | 1.2 | 1.4 | 0.8 | 0.6 | 0.4 | 0.3 | 0.1 | 0.0 | 3.3 | 2.8 | 0.8 | 0.5 | 4.7 | 2.5 | 5.4 | 3.0 | 8.8 | 5.8 |
| Rajasthan | 1.7 | 1.7 | 1.1 | 0.9 | 1.1 | 0.8 | 1.1 | 1.7 | 0.0 | 0.0 | 4.9 | 5.0 | 0.9 | 0.7 | 6.2 | 2.4 | 7.1 | 3.0 | 12.0 | 8.1 |
| Tamil Nadu | 1.1 | 0.9 | 0.9 | 0.9 | 0.8 | 0.6 | 0.6 | 0.5 | 0.3 | 0.1 | 3.7 | 3.1 | 0.8 | 0.7 | 4.2 | 2.5 | 5.0 | 3.2 | 8.8 | 6.3 |
| Uttar Pradesh (includes Uttarakhand) | 1.2 | 2.2 | 0.9 | 1.1 | 1.0 | 1.0 | 0.4 | 0.5 | 0.2 | 0.3 | 3.6 | 5.1 | 0.9 | 0.8 | 4.3 | 4.9 | 5.2 | 5.7 | 8.8 | 10.7 |
| West Bengal | 1.0 | 1.1 | 1.0 | 1.3 | 0.9 | 0.7 | 0.6 | 0.9 | 0.2 | 0.1 | 3.8 | 4.0 | 0.9 | 0.7 | 2.7 | 1.9 | 3.6 | 2.7 | 7.3 | 6.6 |
| All states* | 1.2 | 1.1 | 0.8 | 0.7 | 0.8 | 0.5 | 0.6 | 0.6 | 0.1 | 0.1 | 3.6 | 3.1 | 1.0 | 0.8 | 3.5 | 2.9 | 4.5 | 3.7 | 8.0 | 6.8 |
| Centre* | 0.0 | 0.3 | 0.0 | 0.1 | 0.1 | 0.2 | 0.1 | 0.3 | 0.0 | 1.5 | 0.2 | 2.5 | 0.5 | 0.0 | 4.2 | 1.3 | 4.7 | 1.3 | 4.9 | 3.7 |
| All India* | 1.2 | 1.4 | 0.8 | 0.8 | 0.9 | 0.8 | 0.7 | 0.9 | 0.2 | 1.7 | 3.8 | 5.6 | 1.4 | 0.8 | 7.7 | 4.2 | 9.1 | 5.0 | 12.9 | 10.6 |
* Ratios in these rows are percentages of GDP. All states refers to the selected 14 major states.

Comments will be held for moderation. Your contact information will not be made public.