

 19 July, 2023


With rising inflation becoming a global concern, Balakrishnan and Parameswaran discuss some explanations for the high inflation in India. They find that inflation was driven by a domestic rise in food prices rather than by imports. They also dismantle the claim that inflation is being driven by oligopolistic corporate pricing, before evaluating the efficacy of raising repo rates in controlling inflation. They conclude that inflation cannot be managed by monetary policy alone and must include supply-side management of agricultural prices.
Over the past year, inflation has emerged as the single biggest concern for economic policymakers globally. In India, though the government often justifies its muted stimulus during the Covid pandemic by highlighting the subsequent low inflation, inflation has been higher in 2022 compared to what it was in 2021 Inflation in India was also higher than the 4.9% inflation experienced by the US economy in FY2022-23.
However, any perceived similarity in the inflation experiences of the two countries must end there, as the rise in inflation in the US is at least in part due to a tight labour market, with the rise in the ratio of vacancies to jobseekers resulting in a faster growth of wages (Ball et al. 2022). Although we do not have high-frequency real-time data on employment for India, we do have data that enables us to see which commodity group is driving the inflation. This helps determine whether inflation in India reflects the current global situation brought on by the war in Europe, and the disruption of supply chains that it caused, or something peculiar to the Indian economy.
From the point of view of economic policy, the inflation rate has been higher than the targeted 4% for thirteen quarters in a row (see Table 1). This leaves a question mark on the efficacy of India’s chosen inflation control policy. This may be countered by pointing out that India had chosen flexible inflation targeting, allowing for a range extending from 2 to 6%. Even when this is taken into account, inflation was above the upper bound of 6% during the four consecutive quarters starting from Q4 of FY2019-20, and again in five consecutive quarters starting from Q4 of FY2021-22.
Table 1. Inflation across product groups, in percent
|
Quarter |
CPI |
Food and Beverages |
Pan, Tobacco and Intoxicants |
Clothing and Footwear |
Housing |
Fuel and light |
Miscellaneous |
|
2019-20:Q1 |
3.1 |
1.9 |
4.1 |
1.8 |
4.8 |
2.4 |
4.7 |
|
2019-20:Q2 |
3.5 |
3.3 |
4.8 |
1.2 |
4.8 |
-1.4 |
4.6 |
|
2019-20:Q3 |
5.8 |
9.3 |
3.5 |
1.5 |
4.5 |
-1.1 |
3.8 |
|
2019-20:Q4 |
6.7 |
9.7 |
4.2 |
2.0 |
4.0 |
5.5 |
4.6 |
|
2020-21:Q1 |
6.6 |
8.9 |
7.8 |
3.2 |
3.7 |
1.7 |
5.8 |
|
2020-21:Q2 |
6.9 |
8.9 |
10.8 |
2.8 |
3.1 |
2.9 |
6.9 |
|
2020-21:Q3 |
6.4 |
7.6 |
10.6 |
3.3 |
3.2 |
2.2 |
6.8 |
|
2020-21:Q4 |
4.9 |
4.0 |
10.5 |
4.1 |
3.3 |
3.9 |
6.8 |
|
2021-22:Q1 |
5.6 |
4.5 |
7.6 |
5.0 |
3.8 |
10.8 |
6.9 |
|
2021-22:Q2 |
5.1 |
3.3 |
4.3 |
6.8 |
3.8 |
13.0 |
6.5 |
|
2021-22:Q3 |
5.0 |
3.0 |
3.8 |
7.9 |
3.6 |
12.9 |
6.7 |
|
2021-22:Q4 |
6.3 |
6.3 |
2.6 |
9.0 |
3.5 |
8.5 |
6.7 |
|
2022-23:Q1 |
7.3 |
7.8 |
1.9 |
9.4 |
3.7 |
10.1 |
7.0 |
|
2022-23:Q2 |
7.0 |
7.6 |
1.8 |
10.0 |
4.2 |
11.0 |
6.0 |
|
2022-23:Q3 |
6.1 |
5.6 |
2.1 |
9.9 |
4.6 |
10.5 |
6.0 |
|
2022-23:Q4 |
6.2 |
5.8 |
3.1 |
8.7 |
4.8 |
9.9 |
6.0 |
Notes: i) The inflation rate has been computed as the rate of change of the CPI in a quarter over the same quarter in the previous year. ii) The figures in parenthesis are the weights of each group in the consumer price index. iii) 'Miscellaneous' includes Transport and Communication, Household Goods and Services, Health etc.
Source: Authors’ computations using data from the National Statistical Office.
Those holding on to the view that monetary policy can effectively tackle inflation, contradictorily, are quick to point to the role of global factors – beyond the control of the Reserve Bank of India (RBI) – in the rise of the inflation rate. In this article, we evaluate potential causes of the recent inflation in India, and investigate whether monetary policy has sufficient anti-inflationary potential.
Domestic versus global factors’ contribution to the recent inflation
The quarterly consumer price inflation rates in Table 1 reveal that there was undoubtedly a rise in the inflation rate that coincided with the onset of the war in Europe in February 2022. However, the increase in inflation in Q4 of FY2021-22 is highest for ‘Food and Beverages’, which are mostly domestically produced. For India, the imported goods most likely to have been impacted by war belong to the groups ‘Fuel and Light’, ‘Transportation and Communication’ and ‘Oils and Fats’. Inflation in these groups respectively capture the price of imported oil going into industrial use and transportation, and the price of imported edible oil.
Table 2 reveals that the direct contribution to inflation by all major product groups other than food fell with the onset of the war. On the other hand, the contribution of food inflation increased very strongly in Q4 of FY2021-22, and has remaining elevated ever since. There only plausible interpretation of this data is that the flaring-up in inflation in India in 2022 was led by the rise in food prices
Table 2. Contribution to CPI inflation by product groups, in percent
|
Quarter |
Food and Beverages |
Pan, Tobacco and Intoxicants |
Clothing and Footwear |
Housing |
Fuel and light |
Miscellaneous |
|
2019-20:Q1 |
28.89 |
3.65 |
3.96 |
16.33 |
5.39 |
41.92 |
|
2019-20:Q2 |
44.29 |
3.73 |
2.33 |
14.42 |
-2.76 |
36.08 |
|
2019-20:Q3 |
72.15 |
1.65 |
1.73 |
8.02 |
-1.31 |
17.73 |
|
2019-20:Q4 |
65.35 |
1.77 |
2.08 |
6.47 |
5.64 |
19.01 |
|
2020-21:Q1 |
61.75 |
3.27 |
3.29 |
6.01 |
1.71 |
24.17 |
|
2020-21:Q2 |
59.31 |
4.27 |
2.74 |
4.67 |
2.74 |
27.38 |
|
2020-21:Q3 |
55.87 |
4.46 |
3.40 |
5.25 |
2.29 |
28.92 |
|
2020-21:Q4 |
38.50 |
5.84 |
5.57 |
7.11 |
5.46 |
37.80 |
|
2021-22:Q1 |
37.19 |
3.79 |
5.84 |
6.98 |
12.47 |
33.56 |
|
2021-22:Q2 |
30.12 |
2.40 |
8.61 |
7.55 |
16.14 |
35.04 |
|
2021-22:Q3 |
27.94 |
2.13 |
10.01 |
7.24 |
16.12 |
36.41 |
|
2021-22:Q4 |
45.86 |
1.17 |
9.23 |
5.64 |
8.95 |
29.37 |
|
2022-23:Q1 |
49.54 |
0.74 |
8.42 |
5.14 |
9.41 |
26.78 |
|
2022-23:Q2 |
49.59 |
0.72 |
9.23 |
5.94 |
10.58 |
23.55 |
|
2022-23:Q3 |
42.40 |
0.97 |
10.49 |
7.40 |
11.59 |
27.21 |
|
2022-23:Q4 |
43.3 |
1.4 |
9.3 |
7.7 |
10.8 |
27.0 |
Source: Authors’ computations using data from the National Statistical Office.
This trend in inflated food prices can also be seen in the graph in Figure 1. This finding may also be corroborated by the fact that the contribution of ‘Transport and Communication’ (under the product category ‘Miscellaneous’) and ‘Oils and Fats’ (under the category ‘Food and Beverages’) to overall inflation declined sharply with the onset of the war in Ukraine.
Figure 1. Quarterly CPI inflation
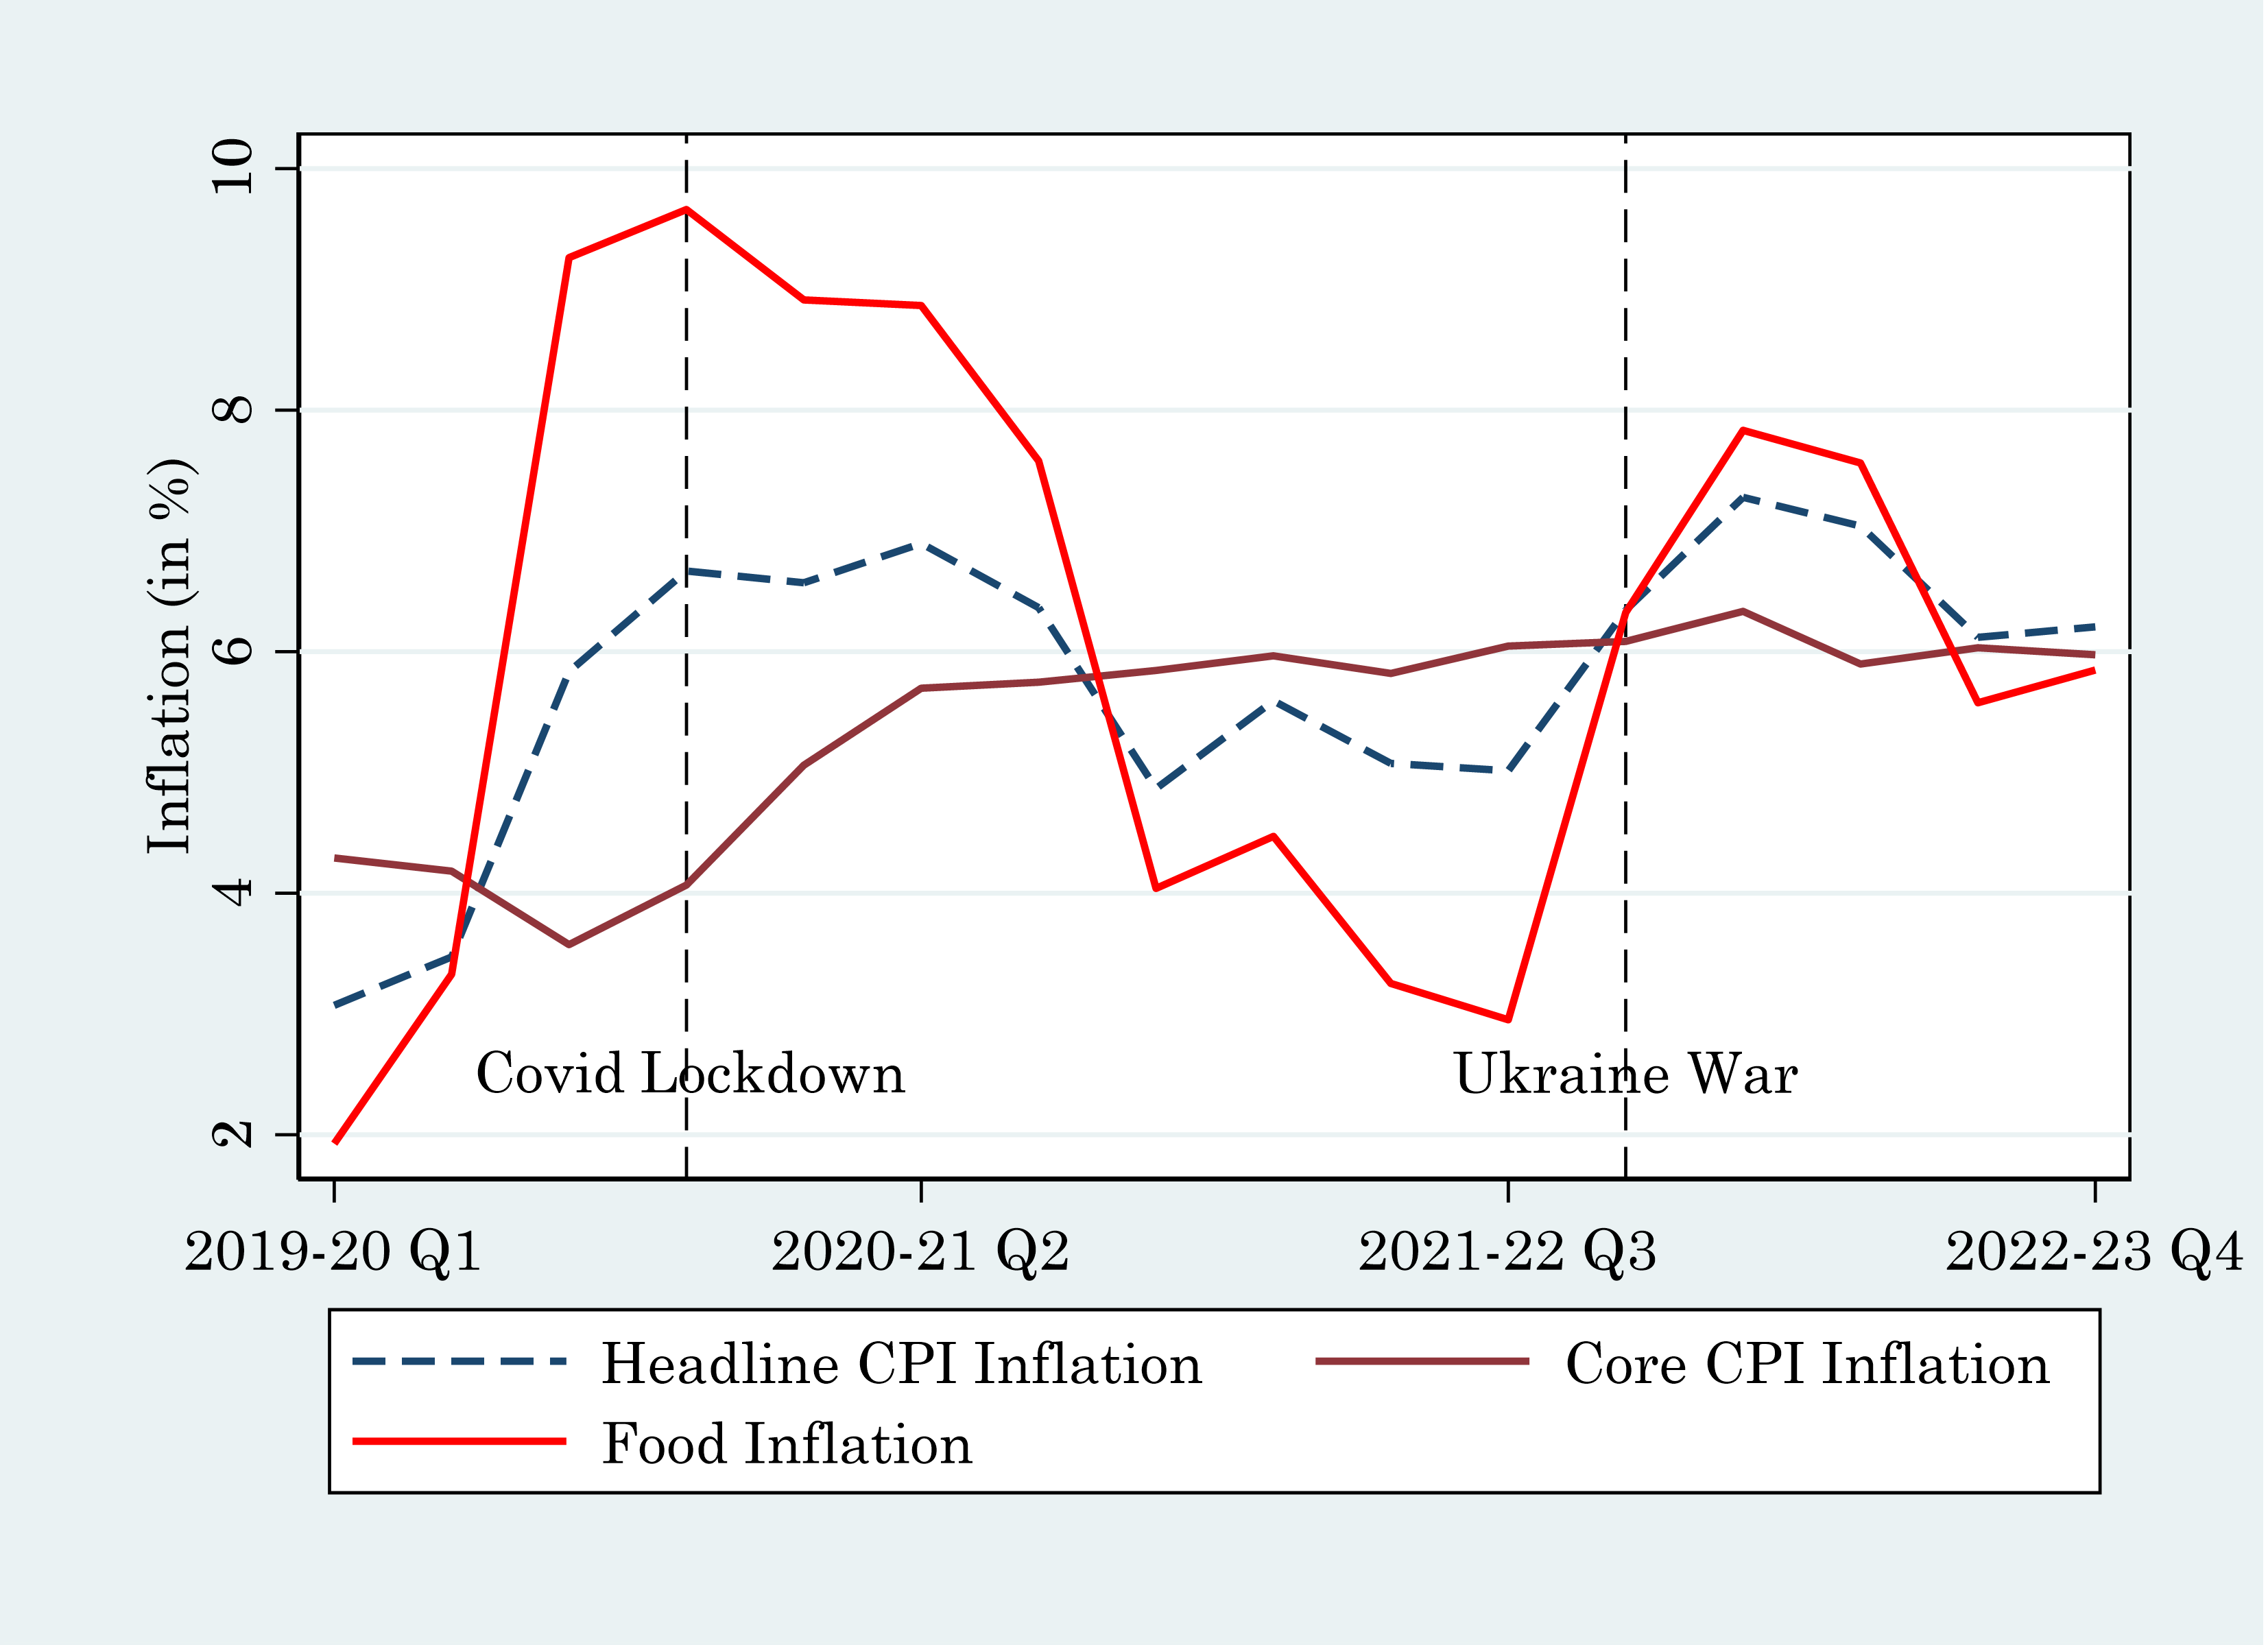
Note: The two vertical lines at Q4 of FY2019-20 and Q4 of FY2021-22 demarcate the period after the announcement of the Covid-19 lockdown in India and the outbreak of the war in Ukraine, respectively.
Source: Authors’ computations using Consumer Price Indices collected from Ministry of Statistics and Programme Implementation (MOSPI).
To establish the source of the inflation, we compute the rate of inflation in India’s import price using data from the International Monetary Fund’s Terms of Trade database. The Index of Import Price of India is constructed using the prices in US dollars, and hence reflect the inflation rate in foreign prices. Table 3 reports the change in India’s import prices. Interestingly, this shows that inflation growth did not pick up with the onset of the war in Europe.
Table 3. Import price inflation
|
Quarter |
Growth Rate (in %) |
|
2019-20:Q1 |
-12.75 |
|
2019-20:Q2 |
-16.73 |
|
2019-20:Q3 |
-5.12 |
|
2019-20:Q4 |
-12.02 |
|
2020-21:Q1 |
-39.65 |
|
2020-21:Q2 |
-12.79 |
|
2020-21:Q3 |
-6.42 |
|
2020-21:Q4 |
24.46 |
|
2021-22:Q1 |
59.47 |
|
2021-22:Q2 |
43.95 |
|
2021-22:Q3 |
41.58 |
|
2021-22:Q4 |
34.66 |
|
2022-23:Q1 |
33.96 |
|
2022-23:Q2 |
16.73 |
|
2022-23:Q3 |
-0.16 |
Note: Growth rate is calculated as the increase over the same quarter of the previous year.
Source: The IMF’s Commodity Terms of Trade database.
These data only confirm what we have already deduced, which is that recent inflation in India has not been driven by global events. Rather, it is due to domestic factors.
Explaining rising food prices
While it is clear that the most recent rise in inflation has been driven by the rising price of domestically produced food products, the question of why food prices have risen faster remains to be answered. For this, we provide a macroeconomic explanation – the rise in food prices was driven by the economic recovery that set in during FY2021-22. Depending upon the extent of a contraction, during the recovery, as income rises, demand grows faster than in the recent past. This could happen even if the economy is only recovering lost ground after a contraction. In the present context, output contracted by 5.8% during the pandemic (that is, FY2020-21). In the following two years – FY2021-22 and FY2022-23, GDP increased by 9.1 and 7.2% respectively. This is faster than the economy had grown in any of the preceding four years. We would expect demand to have grown faster as a result. Unlike non-agricultural output, agricultural output does not expand with alacrity in response to greater demand, as output is constrained by supply in the short run. Econometric evidence on the influence of the sectoral output balance on inflation dynamics may be found in Balakrishnan and Parameswaran (2021).
Though when observing quarterly data (as in Table 1) a surge in inflation appears to coincide with the invasion of Ukraine, it had begun to rise steadily since September 2021. This lends credence to our explanation that the higher inflation reflects the economic recovery. Next, we don’t see procurement prices having played a major role – while it is only cereals that are procured to any large extent, a range of food products show higher inflation. Further, while the minimum support price (MSP) for rice has risen in recent years, the percentage increase is less than the inflation rate; in the case of wheat the percentage increase has declined in the past two years.
Finally, though we have shown that the Indian economy has not faced rising import prices, there is another mechanism whereby foreign trade can contribute to inflation. When exports rise, it lowers domestic supply, raising prices. In this vein, two items in the food basket have seen a very high annual increase in exports during April-December 2022, namely, ‘Cereals and miscellaneous processed items’ and ‘Processed fruits and vegetables’. These have grown by 24 and 33% respectively, and may be expected to have had some impact on domestic prices. But hasty conclusions are best avoided, for we also have the case of pulses, the export of which grew by over 80% with no significant rise in inflation in the price of the commodity. Therefore, the question of whether the high exports of agricultural goods from India in 2022 was a response to global shortage caused by the Ukraine war or due to a growing competitiveness of Indian goods remains moot.
Corporate power and Indian inflation
Recently, it has been asserted that the current inflation in India reflects high pricing power in India’s corporate sector. According to RBI’s former Deputy Governor Viral Acharya core inflation1 remains elevated in India and he ascribes this to the pricing power of just five big corporates (Big 5)2, a narrative which has received wide coverage in the financial press.
A recent paper by Weber and Wasner (2023) asserts that in an emergency, oligopolistic firms collude to raise prices, setting-off a wage-price spiral. Their account is meant to explain the inflationary process during the Covid pandemic in the US. We believe that explanations of inflation in particular instances are not sufficiently generalisable – for instance, as may be seen in Table 1, although inflation in India remained elevated, it did not flare-up in the first phase of the pandemic, having started rising only in late 2019. As for core inflation, where we would expect pricing power of large firms to be most present, its time path in this phase is quite compatible with a delayed response to the inflation in food prices (as seen in Figure 1). So, we do not pursue the argument in Weber and Wasner (2023) any further.
Instead, we address the explanation of recent inflation provided by Acharya, offering five comments on the claim that corporate pricing power is currently driving inflation in India
First, a divergence between inflation rates in India and the rest of the world is not new. After the global financial crisis of 2008, Indian inflation surged, reaching levels higher than the economies of the US and the UK which were at the epicentre of the crisis. This was due to a surge in food price inflation in India, driven by negative agricultural shocks and high procurement price hikes. As food price inflation tends to feed into core inflation, entering the costs of the non-agricultural sector mainly through wages, it would be hasty to conclude that the reason for higher inflation in India is solely due to corporate pricing power. For instance, in February 2023 the wholesale price based food-price inflation was 2.8% while that for manufactured products, the largest commodity group in the index, was only 2%
Second, the argument that corporate power underlies the elevated core inflation in India is based on the observation of a somewhat short time-period. It is true that while wholesale price (WP) inflation eased very considerably in the six months preceding March 2023, consumer price (CP) inflation has not. This mismatch is not new – in FY2021-22, WP inflation had surged by 12 percentage points, but CP inflation actually declined (Reserve Bank of India, 2022). The maintenance of high price hikes by firms in the retail sector even after WP inflation declined in FY2022-23 may have been a compensatory mechanism– with the rising input costs for the retail sector being passed on to consumers with a time lag.
Third, attributing elevated core inflation to the pricing power of the Big 5 assumes that these conglomerates have a high presence in retail trade. Rather, although one would expect their presence is greater in the manufacturing and infrastructure sectors than in retail, it is possible that their economy-wide presence itself may not be so high. Acharya has been quoted as stating that they account for 12% of non-financial sector sales. To us, this does not signal high pricing power.
Fourth, to compare WP inflation with CP inflation, whether headline or core, would be to perpetrate a mismatch. The commodity basket corresponding to the consumer price index includes items such as housing, health, education, recreation and personal care which, naturally, do not enter the wholesale price index. Thus, when a comparison between wholesale price inflation and consumer price inflation is being made, it is like comparing apples with oranges.
Additionally, in all quarters of the financial year that just ended, over 75% of the direct contribution to inflation is by sectors in which the Big 5 are unlikely to be represented in a big way, namely, ‘Food and Beverages’, ‘Housing’ and ‘Miscellaneous’.
Finally, we find the framing of the discourse on inflation in India in terms of core inflation to be limiting. Core inflation leaves out the inflation in food and fuel prices on grounds that these prices tend to fluctuate, but even out– thus not requiring a policy response. This is an untenable assumption in the context of India’s economy, where real food prices have steadily risen. In that context, measuring inflation without considering the price of food excludes what matters most to the public.
India’s inflation control strategy is currently restricted to using the interest rate to dampen aggregate demand. Conveniently for its proponents, it absolves policymakers from addressing the challenge of ensuring the production of food at affordable prices. However, the attempt to explain core inflation in India in terms of the pricing power of corporates may have had a beneficial fallout after all – it has brought to light that the RBI has been unable to control inflation, despite the assumption that the central bank would be able to do so.
Understanding the efficacy of India’s monetary policy for inflation control
In August 2016, the Government of India instituted inflation targeting as the policy for inflation management. With global inflation rising, the RBI raised the repo rate in May 2022, even before the next scheduled meeting of the Monetary Policy Committee. However, we present a summary of evidence from our research which makes us sceptical of its efficacy.
i) Testing the impact of changes in repo rate: Shedding the formal approach to testing the efficacy of monetary policy in controlling inflation (by testing its implicit model), we tested directly for the influence of changes in the real repo rate on inflation in India. We did this by entering the repo rate as an explanatory variable in a structuralist model of inflation.3 The explanatory variables in the estimated structuralist model of inflation4 included the relative price of agriculture goods, the Nominal Effective Exchange Rate (NEER)5, an import price index, and the real interest (Repo) rate.
The model was estimated by instrumental variables implemented using the generalised method of moments (GMM-IV) using quarterly data from Q1 of FY2000-01 to Q2 of FY2022-236. The specification included quarterly dummies, and up to six lags to allow for a lagged impact of the independent variables on inflation.
ii) Our findings: Table 4 presents a summary of the results, focused on the cumulative impact of each explanatory variable on inflation.
Table 4. The relative impact of the determinants of inflation
|
Variable |
Cumulative effect |
Chi-square (p-value) |
|
Growth of relative price of agricultural goods |
0.6424 |
204.58 (0.00) |
|
Real repo rate |
-0.1142 |
131.19 (0.00) |
|
Growth of import price index |
0.0839 |
276.75 (0.00) |
|
Growth of NEER |
-0.3965 |
113.08 (0.00) |
|
R2 |
0.79 |
|
|
Number of Observations |
84 |
|
Note: As all the variables in the original regression were percentage changes, the cumulative impact is the effect of a one percentage point change in an independent variable on CPI inflation after six quarters.
The results indicate that the relative price of agriculture not only has the greatest impact on inflation, it is close to six times that of the real repo rate. This implies that while the real repo rate matters for inflation, monetary policy cannot control it in the presence of an increase in relative prices. This implies that inflation in India can only be controlled by controlling the growth of the relative price of agricultural goods, in particular the price of food. We also found that even the exchange rate has a greater impact on inflation than monetary policy, with a 1 percentage point depreciation in the exchange rate increasing inflation by 0.39 percentage points. As a result, depreciation of the rupee would fuel domestic inflation by increasing the rupee cost of import as well as enhancing export demand.
Additionally, econometric evidence for the New Keynesian Phillips curve7, which the RBI claims as the basis for its anti-inflation policy, is non-existent for India (Balakrishnan and Parameswaran 2021). In particular, we find that the output gap is not a determinant of the inflation rate as assumed. Second, we find no evidence whatsoever for the role of expectations in the inflationary process in India (Balakrishnan and Parameswaran 2022). This is a significant result, for in theory, inflation targeting works by anchoring inflation expectations. If expectations do not drive inflation, this route is closed to monetary policy, and inflation targeting loses its ability to control inflation. As far as we are aware, ours is the first direct test of the role of expectations in driving inflation in India.
Conclusion
The belief that inflation in India can be cured by monetary policy – in particular by the RBI varying the repo rate – stands in the way of adopting measures that would really matter. The official narrative on inflation in India maintains that commodity price movements are random fluctuations, and, being of a transitory nature, may be ignored. However, agricultural price rises, mostly trending upwards, reflect a persistent supply bottleneck. This is what the underlying inflation in India reflects.
We note an affinity between our conclusion in this paper, and a comment by Joseph Stiglitz at the 2022 meeting of the World Economic Forum at Davos: “Killing the economy by raising interest rates is not going to solve inflation in any time frame. […] It is not going to create more food. […] What you do is you have supply-side interventions”. Although Stiglitz was speaking of the global situation but it is fully relevant for India.
The authors would like to thank Parikshit Ghosh, Editor-in-Chief at Ideas for India, for his suggestions. Data used for this article is available from the authors on request.
Notes:
- Core inflation is all-commodity inflation stripped of the inflation of food and fuel prices.
- The corporations identified are the Reliance Group, Tata, Aditya Birla Group, Adani Group and Bharti Telecom.
- The validity of the model in the context of India has been established by us in Balakrishnan and Parameswaran (2021).
- In the structuralist model, inflation originates in an agricultural sector that does not keep pace with the growth of demand for its product generated by growing income in the rest of the economy. This generates an imbalance between the supply and demand for food. Rising agricultural prices erode both industrial profits and the value of workers’ wages, triggering a wage-price spiral – a full account can be found in Canavese (1982).
- NEER is a six-currency trade-weighted index of the dollar-rupee exchange rate (a rise in which would reflect rupee appreciation).
- GMM-IV estimation differs from the ordinary IV estimation in that GMM-IV estimates the parameters by minimising the weighted sample moments, where weights are the inverse of the variance-covariance matrix.
- In the New Keynesian Philips Curve, inflation is modelled as a function of the output gap and expected inflation, where the output gap is the deviation of actual output from its natural level.
Further Reading
- Balakrishnan, Pulapre and M. Parameswaran (2021), “Modelling Inflation in India”, Journal of Quantitative Economics, 19: 555-581.
- Balakrishnan, Pulapre and M. Parameswaran (2022), “What lowered the inflation: Monetary policy or commodity prices?”, Indian Economic Review, 57: 97-111.
- Balakrishnan, Pulapre and M. Parameswaran (2023), “Inflation Theory Comes Full Circle”, Economic and Political Weekly, 58(9): 14-15.
- Ball, LM, D Leigh and P Mishra (2022), ‘Understanding U.S. Inflation During the COVID Era’, NBER Working Paper 30613.
- Canavese, Alfredo J (1982), "The structuralist explanation in the theory of inflation", World Development, 10(7): 523-529.
- Reserve Bank of India (2022), 'Annual Report 2021-22'.
- Stiglitz, JE (2023), ‘How not to fight inflation’, Project Syndicate, 26 January.
- Weber, IM and E Wasner (2023), ‘Sellers’ Inflation, Profits and Conflict: Why can Large Firms Hike Prices in an Emergency?’, University of Massachusetts, Amherst, Economics Department Working Paper 343.

Comments will be held for moderation. Your contact information will not be made public.