

 15 April, 2021


There are various narratives on the trajectory of India’s economic growth, and its key determining factors. This article analyses the recently released GDP data series at 2011-12 prices, extending back to 1950, to establish India’s actual growth trajectory. It also provides a theoretical explanation for the growth, and brings perspective to the role of the economic policies pursued at different stages of India’s economic history post-Independence.
The recent economic history of India has been the subject of some creative storytelling. A popular narrative on India’s transition to a higher growth trajectory attributes it to the economic reforms undertaken in the early 1990s, which purportedly unshackled the economy from the excessive red-tapism associated with the centralised planning introduced by India’s first Prime Minister, Jawaharlal Nehru (see, for example, Sen, Kar and Sahu 2017). This is despite the fact that several studies, including Wallack (2003), Hatekar and Dongre (2005), Rodrik and Subramanian (2005), and Balakrishnan and Parameswaran (2007), have established that more than one growth transition had taken place in India prior to the economic reforms of 1991. Another narrative would have us believe that the economy had performed better (before the Covid-19 shock) under the leadership of Prime Minister Narendra Modi than his predecessor, Manmohan Singh. For instance, Panagariya (2020) claims that the NDA (National Democratic Alliance) government “revived and invigorated the process of reforms” and this along with “improved decision-making helped return India to a higher growth path”. These narratives may be popular, but they are not always based on evidence.
The recent publication by the NSO (National Statistical Office) of a GDP (gross domestic product) series at 2011-12 prices, which extends back to 1950, is an opportune moment to revisit the issue of growth transitions in India. While doing so, we examine whether such transition had to await the liberalisation of the economic policy regime in 1991. In addition, the availability of a continuous GDP series extending up to 2019-20 also allows us to study the effectiveness of the Modi government (2014-2019 and 2019-present), which having been elected on a 'development' ("vikas") platform is assumed to have been path-breaking in its economic impact.
In Balakrishnan, Das and Parameswaran (2021), we first establish the actual, as opposed to assumed, trajectory of growth in India since 1950, and then provide an explanation of it in terms of the theory of economic growth. In the process, we bring perspective to the role of the economic policies pursued at different stages of India’s recent economic history.
Examining India’s growth trajectory
To identify the different phases of economic growth in India, we estimate break points in the time series of GDP from 1950-51 to 2019-20, using the methodology of Bai and Perron (2003)1. Figure 1 presents the results obtained, with the average annual growth rates for each phase.
Figure 1. Phases of growth in India, 1950-2020
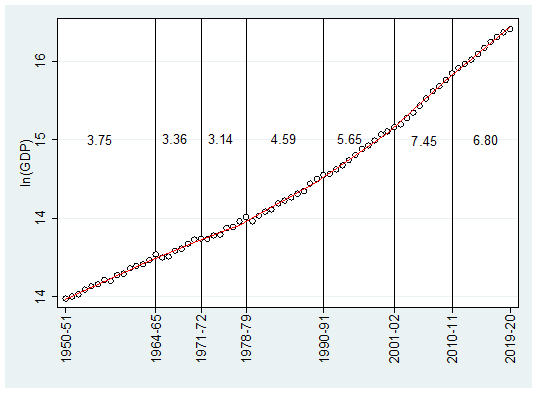
Source: National Account Statistics, Central Statistical Office (CSO).
Notes: (i) GDP numbers are in 2011-12 prices. (ii) Data for 2018-19 are second revised estimates and data for 2019-20 are the first revised estimates.
Figure 1 has clear implications for our understanding of economic growth in India. Contrary to what is often asserted, it did not require the reforms of 1991 for growth to accelerate. That is, though we find growth accelerating from 1991-92 onwards, it had accelerated once before, from 1979-80, and accelerates again later, from 2002-03.
Thus, the growth process is not always tied to the policy regime – in particular, liberalisation reforms. Growth in India has accelerated even in periods that have not witnessed major reforms in the sense of a change in the policy regime. Moreover, as may be seen in Figure 1, the acceleration of growth in the late-70s2 exceeded that attained in 1991-923. To the critical observer, this acceleration stands out. In the words of Kotwal, Ramaswami and Wadhwa (2011), it had taken place at a time when “…India had acquired a reputation as one of the most protected and heavily regulated economies in the world”. Not only had the policy regime remained more or less unchanged but, as they point out, there had not been any upward shift in the variables usually identified as likely to matter for growth transitions, such as the savings rate, foreign direct investment, or exports.
What is discernible from Figure 1 is the continued acceleration of growth in India over time. This feature led us to infer that there is an ‘internal dynamic’ to the growth. In Balakrishnan et al. (2017) we outline a model in which a rising rate of growth arises through cumulative causation once an economy is shocked into motion. Further, we confirm the empirical validity of this model of growth in the Indian context. We also dated the likely onset of growth through cumulative causation. It may be noted that the model leaves room for changes in economic policy, which would work by speeding up or slowing down the internal dynamic of growth. The history of India since 1950 suggests that both these possibilities have occurred at different stages.
Querying the narrative
The implication of our findings in Balakrishnan et al. (2017) is that the narrative of a transition occurring only after the 1991 reforms is not credible. Furthermore, there has been no acceleration of growth since 2014 – when the Modi government took over – despite the claims made. The trend decline started from 2010-11, but the Modi government has not been able to reverse it.
Finally, starting the investigation at 1950, though customary, is somewhat artificial. To address this, we performed the Bai and Perron methodology on the time series extended back to 1900. Now, a positive growth break appears in the early 1950s (Balakrishnan, Das and Parameswaran 2021). This is strong evidence that the economic policies of the Nehru era were path-breaking in having introduced growth into what was once a stagnant colonial economy.
India and the world
We find that growth in India has accelerated continuously since the 1950s, interspersed with two phases in the 60s when it decelerated slightly. This implies that, contrary to claims, the economy had displayed dynamism well before 1991 However, it does not tell us anything about India's performance relative to the rest of the world during this period. This is an issue of interest from a developmental perspective. To get a sense of this we study the trajectory of per capita income in India in relation to that of three comparators, namely, the economy of the world as a whole, East Asia, and China.
Figure 2. India’s per capita income as a percentage of world per capita income
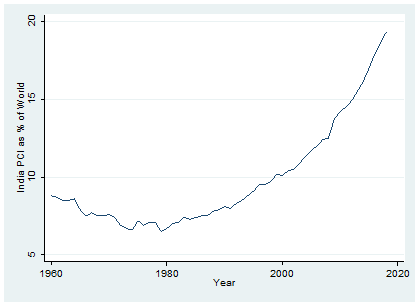
Source: World Development Indicators, World Bank.
GDP per capita is in 2010 US dollars.
Figure 2 shows India losing ground to the rest of the world from 1960 till the late 70s, after which it shows a continued improvement in relative per capita income. Once again, this commences before 1991. We do not present the details of our findings in the comparisons made with East Asia as a whole and with China itself, but the following may be noted. Catching up with East Asia starts later than the late 70s. With China, India has not begun catching up yet!
Conclusion
We establish that multiple growth transitions have taken place in India since independence. We show that certain narratives excessively emphasise the importance of a liberal policy regime for economic growth. The results we report here also show that the economic policies of the Modi government are yet to have an impact on the growth rate of the economy. Our interpretation of these results is that while hurdles to growth in India do exist, they cannot be overcome by liberalisation alone. We believe that a closer look at the East Asian experience would provide a clue as to how to address the challenge in India of low-income levels for a large section of the population – despite continuing, and even accelerating, growth.
I4I is now on Telegram. Please click here (@Ideas4India) to subscribe to our channel for quick updates on our content.
Notes:
- In this method, the phases of growth are identified by minimising the residual sum of squares of the regression of log GDP on time across all the possible partitions of the data series. Note that his method leaves no room for the intrusion of any prior views held by the researcher on the periodisation. For an exposition and details related to the estimation, see Balakrishnan, Das and Parameswaran (2020).
- This growth was based on the economy-wide impact of the green revolution. See Balakrishnan (2010) for further details.
- Here, we refer to the percentage point change in the growth rates across phases, that is, 4.59-3.314 =1.45 and 5.65-4.59 =1.06.
Further Reading
- Balakrishnan, Pulapre and M Parameswaran (2007), "Understanding economic growth in India: A prerequisite", Economic and Political Weekly, 42: 2915-2922.
- Balakrishnan, P (2010), Economic Growth in India: History and Prospect, Oxford University Press.
- Balakrishnan, Pulapre, Mausumi Das and M Parameswaran (2017), "The internal dynamic of Indian economic growth", Journal of Asian Economics, 50: 46-61.
- Balakrishnan, Pulapre, Mausumi Das and M Parameswaran (2021), “Growth Transitions in India: Myth and Reality”, Economic and Political Weekly, 56: 43-49.
- Bai, Jushan and Pierre Perron (2003), “Computation and Analysis of Multiple Structural Change Models”, Journal of Applied Econometrics, 18: 1–22.
- Hatekar, Neeraj and Ambrish Dongre (2005), "Structural Breaks in India's Growth: Revisiting the Debate with a Longer Perspective", Economic and Political Weekly, 38: 1432-1435.
- Kotwal, Ashok, Bharat Ramaswami and Wilima Wadhwa (2011), "Economic liberalization and Indian economic growth: What’s the evidence?”, Journal of Economic Literature, 49(4): 1152–1199
- Panagariya, A (2020), India Unlimited: Reclaiming the lost glory, Harper Collins, India.
- Rodrik, Dani and Arvind Subramanian (2005), “From ‘‘Hindu Growth’’ to productivity surge: The mystery of the Indian growth transition”, IMF Staff Papers, 52(2): 193–222.
- Sen, K, S Kar and JP Sahu (2017), ‘The Stroll, the Trot, and the Sprint of the Elephant: Understanding Indian Growth Episodes’, in K Sen, L Pritchett and E Werker (Eds.), Deals and Development: The Political Dynamics of Growth Episodes.
- Wallack, Jessica Seddon (2003), "Structural Breaks in Indian Macroeconomic Data", Economic and Political Weekly, 40: 4312-4315.

Comments will be held for moderation. Your contact information will not be made public.