

 03 April, 2017


The Indian National Highway Development Project and its components such as the Golden Quadrilateral or the North-South and East-West corridors are planned to alleviate constraints due to insufficient transport infrastructure. This column compares the effects of the Golden Quadrilateral with a counterfactual highway network that is designed to approximately maximise national income while connecting all intermediate-sized cities.
The Indian government launched the National Highway Development Project (NHDP) in 2001 and the Golden Quadrilateral (GQ) was the first completed major part of this initiative. The GQ is a diamond-shaped network among the four largest economic centres, has a length of approximately 5,800 kilometres, and has substantially reduced travel times mostly by upgrading existing highways to higher standards. A number of studies find evidence of positive effects of the GQ (see Datta 2012, Asturias et al 2016, Ghani et al 2016 and Khanna 2016) and similar studies have been undertaken in other countries as well. In this column, I discuss recent work (Alder 2017), where I use a general equilibrium trade model1and satellite data on night-time lights to quantify the aggregate and distributional effects of transport infrastructure at the level of Indian districts.
Highways, trade, and district-level income
I use a general equilibrium model based on Donaldson and Hornbeck (2016) who show that the effect of transport infrastructure can be captured by a measure of market access. Market access depends on the incomes of trade partners (here other Indian districts) and the bilateral trade costs. The model suggests a simple log-linear relationship between real income and market access, which can be estimated using panel data2. I approximate district-level real income with data on night-time lights in each year. Market access is computed from the general equilibrium model and varies over time due to the GQ that reduced trade costs. This variation allows me to estimate the elasticity3 of income with respect to market access, and this estimate can then be used in the model to predict incomes for various counterfactual networks.
Aggregate and distributional effects of the GQ
I first use the model to quantify the aggregate effect of the GQ by comparing actual incomes in 2012 to the model’s prediction without the GQ. The results suggest that aggregate Indian income would have been 2.46% lower in 2012 without the GQ, net of road construction and maintenance costs. Looking at the effects across districts, Figure 1 shows that the GQ mostly benefitted the directly connected areas, while large parts of the country in the Centre and in the East did not benefit.
Figure 1. Effect of GQ across Indian districts
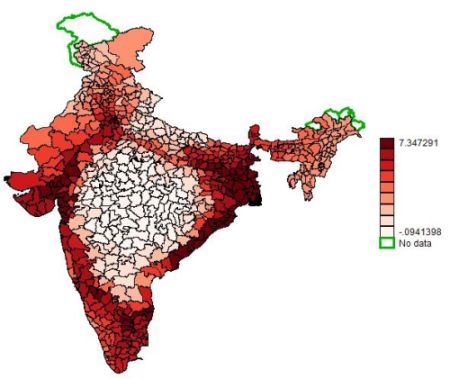 Note: The figure shows the percentage difference in GDP (gross domestic product) generated by the GQ relative to the network without the GQ (in % of GDP in 1999).
 Designing a counterfactual network
I then ask what other network designs could be considered and what would be their aggregate and distributional effects? I argue that a comparison to China’s highway network is particularly interesting, because it is another large country that was facing constraints due to a lack of infrastructure but chose a network design that is remarkably different from India’s NHDP. In the early 1990s, the Chinese government explicitly stated that it would build a highway infrastructure that connects all cities with at least 500,000 people and all provincial capitals, in one common network (Faber 2014). This led to the National Expressway Network (NEN) that is substantially denser than the GQ and the corridors, and it targets different cities. Figure 2 shows these two highway networks.
Figure 2. India´s GQ (green) and China´s NEN (black)
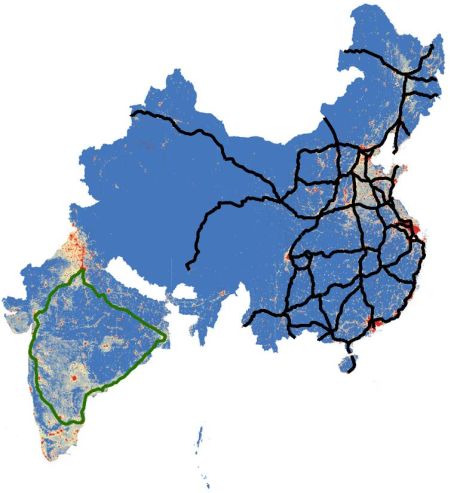
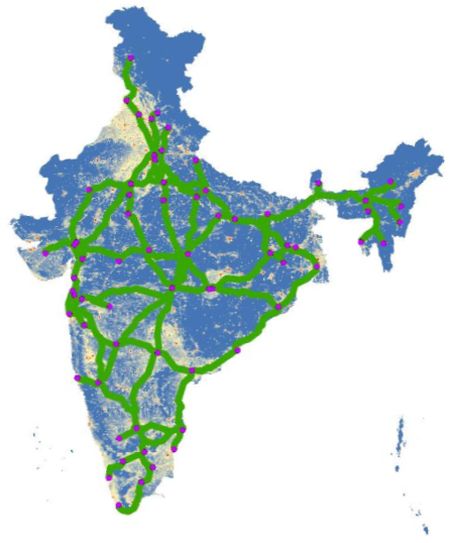
The two countries also had different regional development patterns, with stronger convergence within China than in India. In light of these differences, I ask how India would have developed with a highway network like China’s NEN. The counterfactual Indian network mimics the Chinese strategy by connecting all cities above the population threshold of 500,000 and all state capitals. While the Chinese strategy clearly stated what types of cities should be in the network and one can identify these cities in India, it is not obvious how they should be connected, that is, how dense the network should be and of what structure. I therefore use the trade model and a heuristic algorithm4 that finds the approximately income-maximising network. The algorithm is based on a simple iterative procedure that starts from a fully connected network and gradually removes the least beneficial links, while computing in each step the bilateral travel times, market access, and income predicted by market access (net of road construction costs). The algorithm stops when no further improvements are possible while connecting all targeted cities. The resulting network, shown in Figure 3, is more than five times as large as the GQ. In an alternative counterfactual, I drop the constraint that all cities targeted by the Chinese policy have to be connected, which yields a network that approximately equalises marginal costs and benefits of road construction. This network is still more than four times as large as the GQ and has a similar structure as the previous counterfactual network. These counterfactual networks share the feature that they mostly include the paths of the GQ, but not the North-South and East-West corridors. Both counterfactual networks appear to have a more star-shaped structure, with a centre in Nagpur.
Figure 3. Approximation of income-maximising highway network
Aggregate and distributional effects of the income-maximising network
Replacing the GQ with the counterfactual network would lead to 2.4% higher GDP in the year 2012 compared to the actual network that includes the GQ (net of road construction and maintenance costs). Not surprisingly, the counterfactuals have different distributional consequences compared to the GQ, because they reach a larger part of the country. As shown in Figure 4, the gains are more widely spread across districts when replacing the GQ with the counterfactual network. Especially the lagging regions in the Centre and East would benefit from the counterfactual network compared to the GQ5.
Figure 4. Effect of the counterfactual network that approximately maximises aggregate net income
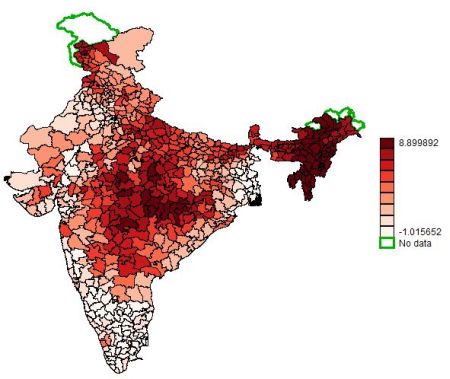 Note: The figure shows the percentage difference in GDP generated by replacing the GQ with the counterfactual network (in % of GDP in 2012).
 Conclusions
The results suggest that the actual highway network, the GQ, led to large gains but unequal effects across regions. A network that connects intermediate-sized cities in a way that approximately maximises net income would lead to large additional aggregate gains. This suggests that the initiative to upgrade the Indian highway network should be expanded substantially beyond the plans of the NHDP. Overall, the denser counterfactual network reaches a larger part of the country and it is more star-shaped. The counterfactual network especially benefits the previously lagging regions and it implies higher spatial convergence than the GQ. This is relevant in light of the findings in the previous literature that there are lagging regions in India that fail to converge to the rest of the country.
Notes:
- The general equilibrium model accounts for indirect effects when multiple locations can trade with each other. For example, an improved highway connection between two districts may not only affect trade among these two districts, but also divert trade away from a third district.
- Panel data (also known as longitudinal data) is a dataset in which multiple entities are observed across time.
- The elasticity captures the percentage change in income when market access increases by 1%.
- Solving for the optimal network in the trade model used here is complex and the number of possible networks is extremely large. Heuristic algorithms are often used to solve a class of decision problems in which exact solutions are necessarily computationally expensive and approximate solutions are sufficient. Such algorithms are designed to solve a problem faster, but they are not guaranteed to find the best network exactly. In this application based on the general equilibrium trade model, I show that different starting points for the algorithm lead to similar networks. Even though the network found by the algorithm is not guaranteed to be the globally optimal network, the result can be viewed as a lower bound for the gains that can be obtained from designing a denser network.
- While capturing the most important mode for transporting goods across Indian districts, one limitation of this exercise is that it focusses on road infrastructure and it would be interesting to consider the railway network as well. Furthermore, it is important to note that the results depend on certain assumptions (for example the interest rate, and the relationship between topography and road construction costs) and on the estimated elasticity of income with respect to market access. While these assumptions and estimates are in line with research on India and other countries, they imply some uncertainty around the exact percentage gain. However, given the magnitudes of the results, the overall conclusion is unlikely to change with reasonable alternative assumptions.
Further Reading
- Alder, S (2017), ‘Chinese Roads in India: The Effect of Transport Infrastructure on Economic Development’, Working Paper, University of North Carolina at Chapel Hill.
- Asturias, J, M Garcia-Santana and R Ramos (2016), ‘Competition and the welfare gains from transportation infrastructure: Evidence from the Golden Quadrilateral of India’, Working Paper.
- Datta, Saugato (2012), "The Impact of Improved Highways on Indian Firms", Journal of Development Economics, 99:46-57.
- Donaldson, Dave and Richard Hornbeck (2016), “Railroads and American Economic Growth: A “Market Access” Approach”, Quarterly Journal of Economics, 131(2):799-858.
- Faber, Benjamin (2014), "Trade Integration, Market Size, and Industrialization: Evidence from China´s National Trunk Highway System", The Review of Economic Studies, 81 (3):1046-1070.
- Ghani, Ejaz, Arti Grover Goswami and William R Kerr (2016), "Highway to Success: The Impact of the Golden Quadrilateral Project for the Location and Performance of Indian Manufacturing", The Economic Journal, 591(126):317-357.
- Khanna, G (2016), ‘The Road Oft Taken: The Route to Spatial Development’, Social Science Research Network (SSRN).

Comments will be held for moderation. Your contact information will not be made public.