

 15 February, 2016


Several policies aimed at reducing Delhi’s air pollution have been implemented this winter, but what remains unclear is where the pollution comes from. This column takes stock of what we know about pollution sources and the portion contributed by each. It contends that good information systems are required to turn the critical convergence of public concern, policymaker attention, and academic contribution
This winter, Delhi’s government and the judiciary have implemented several policies aimed at cutting Delhi’s air pollution. The
On some days the air may be clearer. But what remains hazy is where Delhi’s air pollution comes from. Over the years multiple attempts to find out – called source apportionment studies – have yielded contradictory results. There are numerous suspects: cars and trucks, smokestacks, farm fires in Punjab and Haryana, and dust from construction sites - to name just a few. Without a better knowledge of the portion contributed by different sources any policy response, no matter how bold, will be a little like a blind attempt to pin the tail on the donkey.
But that too may be changing. The Indian Institute of Technology (IIT) Kanpur is now releasing a major study, commissioned by the Delhi environment department in 2011. This promises to give the clearest picture of source apportionment yet. And other new sources of quality information on air pollution are appearing: the government has plans to add 10 new air quality monitoring stations in Delhi, and news outlets are setting up their own monitoring systems, including IndiaSpend #Breathe.
This could be a turning point in our understanding of the sources of Delhi’s deadly air, as well as our ability to craft smart policies that shut them down. We at Evidence for Policy Design (EPoD) are researchers who assist government ministries in formulating such responses, and we think it’s worth taking stock of what we know now and how we came to know it. That clarity will make it easier to turn this critical convergence of public concern, policymaker attention, and academic contribution into fuel for a smart policy response that will stick.
Search out the source
There are two ways of conducting source apportionment studies: direct sampling based on chemical analysis, and modelling emissions dispersion using secondary data. International best practice is to rely on receptor-based studies, but where budgetary constraints inhibit adequate sampling, analysis using dispersion models may dominate.
Over the past 10 years, and excluding the just completed IIT Kanpur study, we count 15 source apportionment studies that sought to pinpoint the sources of emissions and their respective contributions to Delhi’s overall air pollution. Ten
Figure 1. Sources of air pollution in Delhi
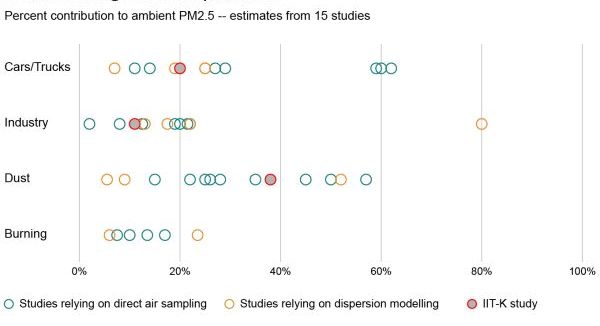
Note: The methodology followed by the IIT-Kanpur study is not yet available to the public.
Getting a reliable picture of air pollution is inherently difficult due to Delhi’s changing weather conditions and constantly shifting patterns of emissions throughout the day, week, and year. Moreover, some of the most important pollution sources lie outside the National Capital Region (NCR)1 of Delhi. This makes it important that direct air sampling studies are broad enough to capture multiple sources and take samples at several different time points. An inability to do this – largely due to budgetary considerations – and the resulting differences in what gets sampled are an important part of the explanation for the large differences across studies.
In such situations, secondary data based modelling may well be the best option for source apportionment studies as long as these secondary sources are reliable and span relevant emission sources. Right now, we lack a measure of whether that is the case. Without standardised best practices about which secondary data sources and which model to use, source apportionment studies will continue to give conflicting results going forward.
The new IIT-Kanpur study improves on previous attempts by taking seasonal variation in pollution into account, showing that vehicles are a much bigger contributor to air pollution in the winter than in the summer. The study also documents a broad range of sources like garbage burning, dust, and crop burning to paint
Fine-grained data for a smart response
Source apportionment studies, even when done well, are not enough. They need to be complemented by a network of air quality monitors that offer a picture of air pollution in real-time, allowing citizens to protect themselves during periods of high pollution and helping policymakers target the most polluted areas of the city.
The backbone of Delhi’s air quality monitoring network is its set of 21 ambient air monitoring stations, 11 of which have data that are accessible to the public. The city’s main air pollution concern is PM2.5 (Particulate Matter), suspended particles small enough to be trapped in the lungs. PM2.5 has been shown to cause lung cancer, cardiovascular and respiratory diseases, asthma, and a host of other health problems.
Data obtained from the website of the Central Pollution Control Board (CPCB) for the 11 monitors run by the Central Pollution Control Board and Delhi Pollution Control Committee (DPCC) show that PM2.5 was being recorded only 29% of the time at these sites last winter – the season associated with the most severe levels of particulate pollution. Coverage since March 2015 has increased to 46%, but these gaps in the data make it difficult to reliably characterise the actual air quality situation in the city. Continuing the trend of improvement in coverage should be a high priority.
Figure 2. Are Delhi’s air quality monitors working?
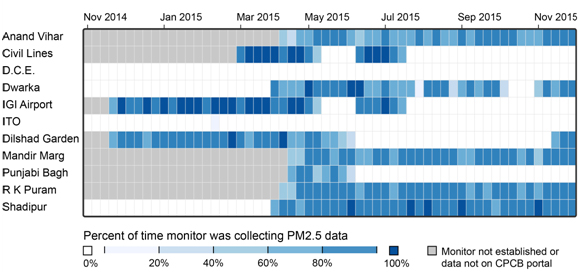
Source: Central Pollution Control Board (CPCB) data
Coverage patterns show that monitor downtime tends to be concentrated in long
For the quality of air to improve, the quality of information must first rise. With even a rough idea of source apportionment, the government can take actions like shutting down dirty power plants and pushing neighbouring states to better regulate crop-burning. Once the low-hanging fruit is picked, policymakers will need increasingly detailed information on location, source, and type of air pollution to design a smart policy response. Now is the time to get the information systems in place that will inform the next decade of environmental policy in the city, and beyond.
This article first appeared on IndiaSpend: Part 1 & Part II.
Notes:
- This includes New Delhi and urban areas surrounding it in neighbouring states of Haryana, Uttar Pradesh and Rajasthan.

Comments will be held for moderation. Your contact information will not be made public.