

 25 February, 2013


Despite two decades of fast growth of per capita GDP, India has experienced a very slow decline in poverty. The column suggests that this disconnect between GDP growth and poverty decline can largely be attributed to the positive feedback emanating from a skill biased growth pattern.
We celebrate growth mainly because we believe that it can have an impact on poverty. However, despite two decades of fast growth of per capita GDP in India, poverty has declined quite slowly. In this column, we propose to explore why this might be so.
Figure 1 below shows growth over the last 20 years has moved the entire distribution to the right. In other words, all income groups have experienced some increase in their consumption. In fact, the population below the poverty line1 has come down from around 45% to 30%. This seems to suggest that we have made reasonable progress on the poverty front. However, in the context of the fast per capita GDP growth that India has had, its poverty performance leaves a great deal to be desired.
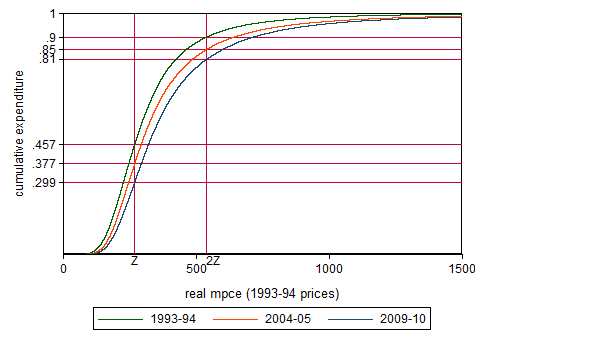
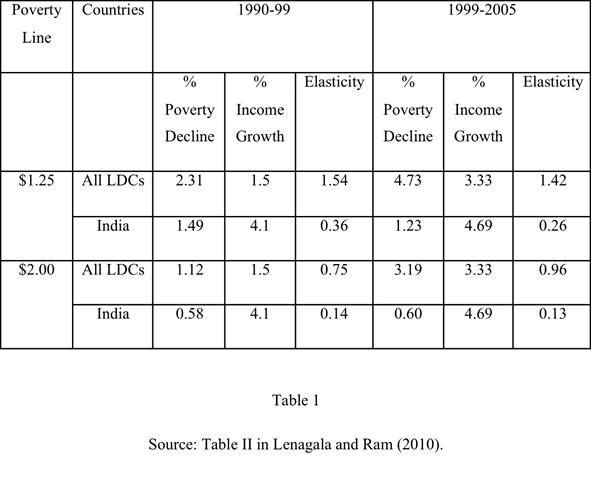
Table 1 below brings out the fact that Indian performance in this respect has been much worse than the average performance in the developing world.
Table 1. Income growth and poverty reduction4
Structure of the Indian economy
Though it is the organised or formal sector5 that is always in the news, most of India and certainly most of its poor, make their living in the unorganised or informal sector6.
To get out of poverty, they need to either increase productivity of their existing activities or to acquire skills enough to gain better paying jobs in the formal sector. Even when they do not acquire skills, workers leaving agriculture and finding employment elsewhere raises the wages of those left behind as now the latter have more land to work on. Thus, when the unskilled workers find unskilled non-farm jobs even at the same wage as before, they still make others better off. Job creation in the non-farm sectors whether for skilled or unskilled jobs is crucial for poverty reduction.
In 2004-2005, the informal sector produced 58% of national domestic product and employed 93% of India’s labour force (Kohli and Hazra 2008). If the formal sector produces 42% of the output with only 7% of the labour force, it is clearly hugely more productive than the informal sector. It also has the potential to raise its productivity much faster through technology transfer from the developed world due to superior access to credit, infrastructure and skilled labour. The businesses in the informal sector are in the informal sector precisely because they lack access to these crucial inputs. The policies that will have an impact on poverty are those that would facilitate productivity improvement in the informal sector through improving access to crucial inputs, and those that convert the unskilled into skilled.
Growth drivers in the Indian economy
Which specific sectors within the formal sector are driving GDP growth and how much employment are they providing for the unskilled workers that constitute the poor?
To a large extent, what triggered India’s growth episode in the 90’s was the happenstance of the availability of a large excess supply of graduates from engineering and management schools to fill the large excess demand in the international markets for software engineers and managers (Kochar et al 2006). India’s growth spurt was spearheaded by very small sectors such as business services that employed a very small part of Indian labour force and that too, mostly the highly skilled. The fastest growing sectors in India were skill intensive sectors that created very little employment in general, especially for the unskilled and the poor.
During the period 1993–2004, the fastest growing sectors were mostly high-end services such as business services, communications, research, hotels and restaurants, banking, insurance etc. The growth in most of these sectors was not accompanied by much increase in the employment of unskilled workers. There were only three non-farm sectors that did increase the employment of the unskilled - trade, transportation and construction – all low-end services. During this period, the labour force working in agriculture declined by 7% and almost all of that labour was absorbed in these three sectors. The labour drawn out of agriculture was still not substantial; in fact, the labour to land ratio increased in all but four states during this period. Real wages increased but this would not have happened had there been no agricultural productivity increase.
The pattern of growth changed slightly during 2004-2009. A few manufacturing sectors such as electric machinery, metal products, wood, furniture and transport equipment joined the list of fast growing, high-end service sectors. The fact remained however that the growth in none of these sectors provided much employment for the unskilled7 workers. In fact, many of these sectors shed unskilled labour. Almost all the additional jobs created for the unskilled during this period were in a single sector - ‘construction’. It employed 30% of the unskilled workers in 2009-20108 (Kotwal and Roy Chaudhuri 2013). Perhaps, because of the massive employment created in ‘construction’, the labour to land ratio decreased in most states helping to raise the real wages in agriculture. This partially explains why the growth elasticity of poverty has improved over this period.
Demand composition as a determinant of which sectors grow fast
Why did the sectors that employed unskilled labour not grow fast? While the high-end services are export-oriented and grew fast in response to the rising international demand, the informal sectors that employ unskilled workers are typically non-traded services plus agriculture. The growth in these activities typically depends on the growth in derived demand for them. When a software engineer working for Infosys sees an increase in her income, how would she spend this additional income? She already has a driver, a maid and a cook. She is not going to hire more domestic help. She might buy an iPad, visit more holiday resorts and buy higher quality processed and unprocessed food items. The component of value added by the unskilled in producing these items is quite limited.
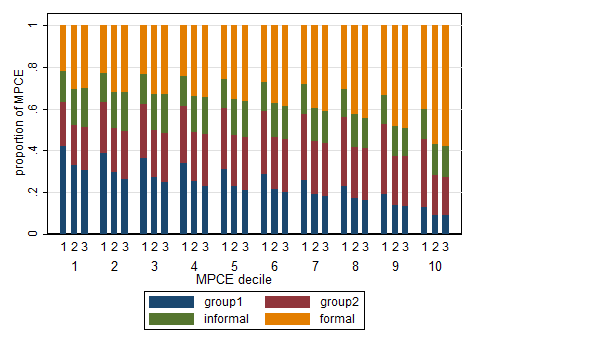
Figure 29 below (shows how people at different levels of income spend their money and how this pattern has varied during 1993-2009. Group 1 and Group 2 are ‘food grains and pulses’ and ‘other unprocessed food items’10 respectively. Group 3 and 4 represent the informal sector (other than agriculture) and formal sector products respectively. Notice that richer people spend more on the formal sector products. Moreover, over time, all income groups have increased the share of their consumption of formal sector products. It is clear that as incomes grow, the demand for skilled labour grows much faster than for the unskilled labour. That is, only a small part of the income gains, especially of the rich, trickles down to what the poor can produce. The more concentrated the income gains at the top, the lower is the trickle down. There in lies a part of the explanation for our motivating question.
This implies that sectors such as dairy, fruits, vegetables, meat and poultry have a high growth potential and also hold the promise of providing employment to relatively unskilled people. It should be a matter of high priority to remove any impediments to their growth.
Figure 2: Consumption pattern across income groups1112
The role of education
So far we have only talked about poverty reduction in terms of the employment for the unskilled. However, a big part of the development process is the skilling of the unskilled labour force. If the educational system rapidly converted the unskilled into skilled, they would be absorbed into the fast growing formal sector and there would be rapid poverty reduction. Kotwal and Roy Chaudhuri (2013) show that the educational premium13 for graduates has increased continuously from Rs. 322 per week in 1993 to Rs. 494 per week in 200914. This indicates that the excess demand for graduates persists and has grown. In other words, the educational system is not generating skills15fast enough.
To explore the root cause of the poor quality of our graduates, we need to start at the primary education level across the country. Pratham, the foremost educational NGO in India has been actively studying the problem of the quality of education for many years now. For eight years now they have published Annual Status of Education Report (ASER)16.
The findings are alarming.
“In 2010 nationally, 46.3% of all children in Std. V could not read a Std. II text. This proportion increased to 51.8% in 2011 and further to 53.2% in 2012”. Similarly, “…in 2010, of all the children enrolled in Std. V, 29.1% could not solve simple two-digit subtraction problems with borrowing. This proportion increased to 39% in 2011 and further to 46.5% in 2012. Barring Andhra Pradesh, Karnataka and Kerala, every major state shows signs of a substantial drop in arithmetic learning levels.”
How can a skilled labour force be built on such a weak base?
Thus, a part of the answer lies in our educational system. Without major improvements in our educational system all talk of demographic dividend is empty. Undereducated, unskilled youth will offer little dividend, if any.
Conclusions
To sum up, the slow rate of poverty decline despite fast growth can be attributed to: (1) the lack of access of the informal sector to crucial inputs that would allow it to improve its productivity, (2) the positive feedback emanating from a skill biased growth pattern so that the skilled workers (non-poor) spend their increased incomes mostly on the goods produced by skilled workers, (3) the failure of the educational system in creating a skilled labour force fast enough. The policies required to remedy (1) and (3) require institutional improvement and that in turn require concerted efforts over a long period. One avenue that will have an impact on poverty in the short run is to facilitate diversification of agriculture so that farmers could shift from food grains to horticulture, dairy and poultry for which the demand is growing across the country.
Most of the discussion in this column is drawn from Kotwal, Ramaswami and Wadhwa (2011) and Kotwal and Roy Chaudhuri (2013)
Notes:
- As defined by the Tendulkar committee.
- Z and 2Z represent the poverty line and twice the poverty line respectively.
- In 1993-1994 rural Maharashtra prices.
- Growth Elasticity of Poverty defined as the percentage of poverty decline divided by the percentage of income growth. During the latest National Sample Survey (NSS) period (2005-2010), the growth elasticity of poverty has improved to 0.59 for $1.25 poverty line and to 0.20 for $2 poverty line (Authors’ calculations based on Lenagala and Ram (2010) methodology). This is a welcome improvement and yet it is far from satisfactory.
- Public and private sector firms employing 10 or more people
- Family owned farms and shops, trades people, business establishments employing less than 10 and typically 1 or 2 people
- Defined as ‘below graduate’.
- As compared to only 9% in 1993-1994.
- Reproduced from Figure 8 in Kotwal and Roy Chaudhuri (2013).
- Dairy, fruits, vegetables, fish, meat, poultry etc.
- The bars marked 1, 2, 3 in the graph represents the 50th (1993-94), 61st (2004-05) and 66th (2009-10) NSS rounds respectively.
- The figure shows how the percentage share of each group varies across incomes. Kotwal and Roy Chaudhuri (2013) analyse the consumption expenditure data in the NSS round of 2009 and show that the absolute amount of expenditure on Group 1 does not vary much across income groups but that on Group 2 shows a substantial increase. The groups in the descending order of income elasticities (how much does the consumption on that particular group increases when the income (here total consumption) increases by one rupee) are: Group 4, Group 2, Group 3 and then Group 1.
- The additional income accruing to the male cohorts of the same age group over illiterates.
- In terms of 1993 rural Maharashtra prices
- Here, we need to keep in mind that ‘skills’ do not mean just degree certificates. It may be the case that many graduates with degrees are simply not employable because of the poor quality of education has given them certificates but no skills.
- http://img.asercentre.org/docs/Publications/ASER%20Reports/ASER_2012/nationalfinding.pdf
Further Reading
- Kochhar, K., U. Kumar, R. Rajan, A. Subramanian and I. Tokatlidis. 2006. “India’s pattern of development: What happened, what follows?" Journal of Monetary Economics, 53 (5): 981–1019.
- Kohli, R.and S. Hazra. 2005. "Estimation of Informal Sector Contribution in the Net Domestic Product-Indian Experience". Delhi : Expert Group on Informal Sector Statistics.
- Kotwal, A., B. Ramaswami, and W. Wadhwa. 2011. "Economic Liberalization and Indian Economic Growth: What s the Evidence?" Journal of Economic Literature 49 (4): 1152-1159.
- Kotwal, A. and A. Roy Chaudhuri. 2013. "Why Is Poverty Declining So Slowly in India?", Paper presented at the IGIDR Silver Jubilee Conference.
- Lenagala, C., and R. Ram. 2010. "Growth elasticity of poverty: estimates from new data." International Journal of Social Economics 37 (12): 923-932.

Comments will be held for moderation. Your contact information will not be made public.