

 08 July, 2022


Despite female education rates rising, India has one of the lowest female labour force participation rates globally. Using data gathered through profiles on Shaadi.com, this article by Diva Dhar estimates the penalty in the marriage market for women who choose to work after marriage. By looking at how women’s career choices are determined by marital incentives, this article also highlights the role that gender norms play in female labour force participation rates in India.
In the summer of 2020, like many viewers in India and across the world, I was binge watching Sima Aunty on the Netflix show ‘Indian Matchmaking’. Proclamations on marriage in India peppered the show – “Indians are scared of daughters-in-law who are lawyers” or “If [the wife] works, who will take care of the kids?”. Unfortunately for Indian women, though these proclamations may have been dramatised for effect, they contained more than a kernel of truth. In a recent study (Dhar 2022), I quantify the extent of the bias women face in the marriage market, if they wish to work. The statistics are startling, but likely ring true for many career-oriented young women trying to find a partner in India.
Motivation
India has one of the lowest female labour force participation rates globally. This has persisted despite the fact that female education rates have risen, infrastructure has improved, and fertility rates have fallen (Chatterjee et al. 2018). There are many interlinked explanations, from measurement error (Deshpande and Kabeer 2020), to the urbanisation of jobs (Chatterjee et al. 2015), to safety (Siddique 2019, Borker 2021). Yet another important but understudied reason for women staying out of the workforce may lie in gender norms related to marriage - and specifically male preferences in the market for spouses.
Half of Indian adults think married women whose husbands earn well should not work outside the home (Coffey et al. 2018). Research in contexts such as the United States has suggested that marital incentives and male preferences may constrain women from joining, staying, or exceling in the labour force (Fisman et al. 2006, Bursztyn et al. 2017). The desire to find a spouse more easily may be far more consequential in India, a country characterised by near-universal marriage rates (Kashyap et al. 2015, International Institution for Population Sciences (IIPS), 2017). Women’s choices or decisions to work may therefore be closely linked to marital incentives and outcomes in the marriage market.
To explore this possible link, I conducted a novel experiment on the popular matrimonial website Shaadi.com1, designed to cleanly identify the discrimination that working women face when looking for a spouse. I also consider whether this bias reduces or increases depending on whether the woman earns more or less than her male suitor.
Experiment design
I use what is known as a correspondence experiment (Bertrand and Mullainathan 2004, Edelman et al. 2017), to test for male bias against working women.
I first create typical marital profiles for women from different castes/sub-castes modelled on real profiles. These profiles have photographs hidden until a male expression of interest is received (a common practice on Shaadi.com). The profiles are identical on all characteristics (such as age, height, education, lifestyle), except for those relating to work and income.
I then identify a random sample of 2,750 active male suitors from the website within certain castes/sub-castes, and within a specified geographical location (around Delhi) and annual income bracket (Rs. 4,00,000-7,00,000). These male users are sent expressions of interest from the female profiles belonging to their caste/sub-caste. The type of profile contacting them was systematically varied, with men randomly assigned to receive messages from one of five types of women.
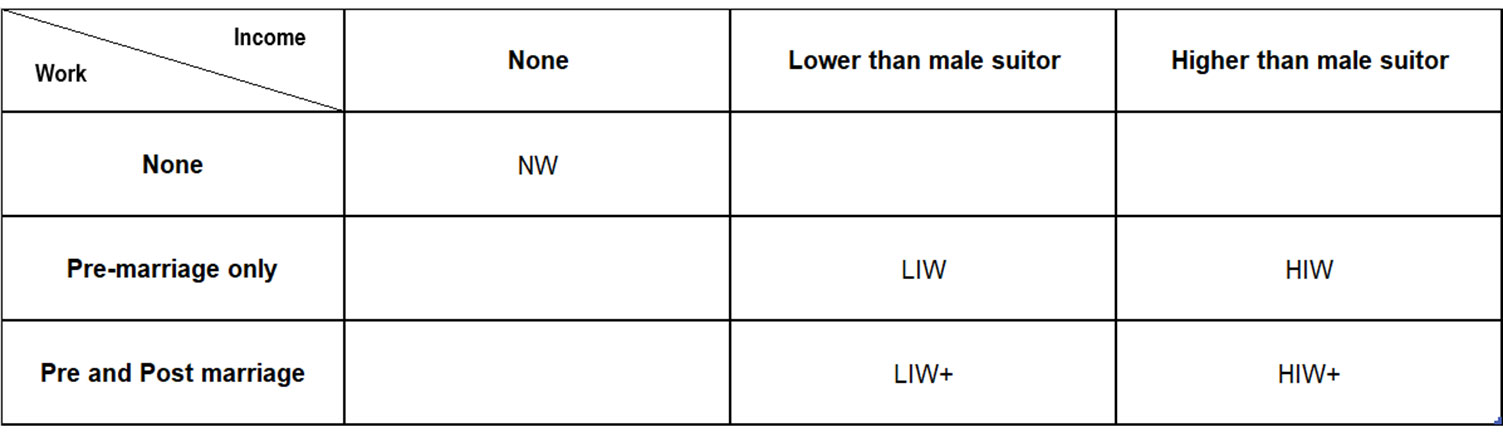
i) Never Worked (NW) – Woman is not working and does not intend to work after marriage.
ii) Continue Working H (HIW+) – Woman is working with a high income (Rs. 700,000 - 1,000,000)) and wishes to continue working post marriage.
iii) Continue Working L (LIW+) – Woman is working with a low income (Rs. 200,000 – 400,000) and wishes to continue working post marriage.
iv) Stop Working H (HIW) – Woman is working with a high income (Rs. 700,000-1,000,000) and wishes to give up work post marriage.
v) Stop Working L (LIW) - Woman is working with a low income (Rs. 200,000-400,000) and wishes to give up work post marriage.
For easier reference, these variations on work and income are captured in Table 1.
Table 1. Summary of the five treatment arms
After sending the invites from one of these profiles based on the randomisation, the responses from male suitors were monitored for a period of 30 days. Male suitors could accept, decline, request for a photo, or choose to not respond. These responses were the primary outcome of the study. These male responses therefore reflect revealed preferences at the screening stage, and avoid the challenges of adjusting for differences in physical appearance or other characteristics.
Findings
The results of the test are striking. All else being equal, I find that women who have never worked are likely to get the highest number of positive responses from male users. Around 70% of men will accept their responses. Next, women who have worked but are willing to give up work after marriage receive around 66% responses – but these are not statistically significant for the most part. However, there is a sharp drop in response for women who want to continue working after marriage. Their acceptances rates are at 59.6% and 54.7% for the high income (HIW+) and low income (LIW+) groups respectively. This represents a difference in overall response rates of 10 to 15 percentage points from the Never Worked (NW) group, which can be attributed simply to women's intentions to work after marriage. Figure 1 summarises these findings.
Figure 1. Mean responses across treatment groups
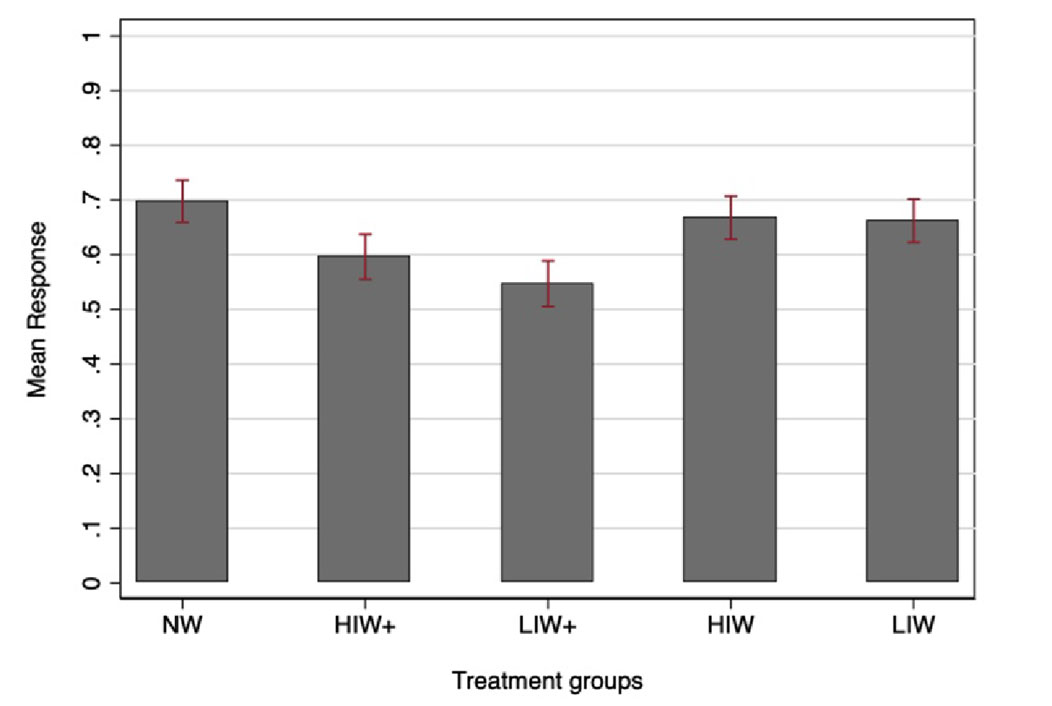
Notes: (i) Mean responses on y-axis is the proportion of responses by male suitors to all invites received from each treatment group, for example, 0.7 = 70% response rate (ii) The maroon standard error bars represent the 95% confidence intervals. A 95% confidence interval means that if you were to repeat the experiment over and over with new samples, 95% of the time the calculated confidence interval would contain the true effect.
How strong is the penalty in the marriage market for a woman if she intends to pursue her career after marrying? These average response rates imply that women who have never worked receive 15-22% more interest in the marriage market compared to women who want to keep working. This means that for every 100 men who respond to a woman who has never worked, only 78-85 men will respond to a woman who wants to keep working. These results are consistent in the regression analyses across specifications: men are demonstrably less interested in woman who work.
Interestingly however, women who earn relatively more are not penalised the most. Instead they receive more interest, not less, than their lower earning peers. My study shows that men were 10 percentage points less likely to respond to women who earn more than them and want to work after marriage (HIW+ group). They were 15 percentage points less likely to respond to women who want to continue work but earn less than them (LIW+ group). These results indicate that women who want to work but earn less than their male suitors elicit the least interest.
So while there is a clear norm against having a working wife, the additional income from a higher-earning wife seems to help weaken the penalty. Prospective husbands regard higher household income as more of a sweetener, indicating there is a weak income effect, which runs counter to the gender norms channel. There is also little evidence for a ‘human capital development’ channel where there would be greater preference for wives with some work experience before marriage, even if they were not breaking the norm of working after marriage. All told, the gender norm that women should not work after they get married seems dominant in explaining these results
There are also clear differences by caste. The overall penalty is driven by the relatively higher castes in the (limited caste) sample such as Brahmins and Agarwals.
Conclusion
Sima Aunty knows a thing or two about the marriage market. The unfortunate reality is that there is a sizeable penalty in the marriage market for women who express an interest in pursuing a career after work. In my study, this is predominant in the higher castes, potentially given associations with more conservative gender beliefs. These male and family preferences influencing one of the most important decisions in our lives – finding a spouse – suggest that gender norms may play an extremely important role in explaining the puzzle of India’s abysmal female labour force participation rates.
Note:
- Shaadi.com is an online matrimonial matchmaking service. Founded in 1997, it is a familiar name in Indian households.
Further Reading
- Bertrand, Marianne and Sendhil Mullainathan (2004), “Are Emily and Greg More Employable Than Lakisha and Lamal? A Field Experiment on Labor Market Discrimination”, American Economic Review, 94(4): 991–1013.
- Borker, G (2021), ‘Safety First : Perceived Risk of Street Harassment and Educational Choices of Women’, World Bank Policy Research Working Paper No. 9731.
- Bursztyn, Leonardo, Thomas Fujiwara and Amanda Pallais (2017), “‘Acting Wife’: Marriage Market Incentives and Labor Market Investments”, American Economic Review, 107(11):3288–3319. Available here.
- Chatterjee, Esha, Sonalde Desai and Reeve Vanneman (2018), “Indian paradox: Rising education, declining womens’ employment”, Demographic Research, 38(31): 855-878.
- Chatterjee, U, R Murgai and M Rama (2015), ‘Job Opportunities Along the Rural-Urban Gradation and Female Labor Force Participation in India’, World Bank Policy Research Working Paper No. 7412.
- Coffey, Diane, Payal Hathi, Nidhi Khurana and Amit Thorat (2018), “Explicit Prejudice: Evidence from a New Survey”, Economic and Political Weekly, 53(1): 46-54.
- Deshpande, A and N Kabeer (2021), ‘Norms that matter: Exploring the distribution of women’s work between income generation, expenditure-saving, and unpaid domestic responsibilities in India’, WIDER Working Paper 2021/130.
- Dhar, D (2022), ‘Indian Matchmaking: Are Working Women Penalised in the Marriage Market in India?’, BSG Working Paper.
- Edelman, Benjamin, Michael Luca and Dan Svirsky (2017), “Racial Discrimination in the Sharing Economy: Evidence from a Field Experiment”, American Economic Journal: Applied Economics, 9(2): 1–22.
- Fisman, Raymond, Sheena S Iyengar, Emir Kamenica and Itamar Simonson (2006), “Gender Differences in Mate Selection: Evidence From a Speed Dating Experiment”, 121(2): 673 -697.
- International Institute for Population Sciences (2017), ‘India National Family Health Survey (NFHS-3), 2015-16 (Vol. 1)’, IIPS.
- Kashyap, Ridhi, Albert Esteve and Joan Garcia-Roman. (2015), “Potential (Mis)match? Marriage Markets Amidst Sociodemographic Change in India, 2005-2050”, Demography, 52(1): 183–208.
- Siddique, Z (2019), ‘Does a fear of violence affect female labour supply in India?’, Ideas for India, 6 March.

By: Dattakiran 01 August, 2022
2-4,00,000 p.a. is very low income in India, equivalent to what a housemaid or gardener gets paid. 7-10,00,000 is also considered low in the marriage market. Even the author who conducted this survey/study would never marry a man making this low salary. So, the study only suggests that men consider that it is better off for his spouse sitting off at home rather than working for such a measly salary. Too bad that the author didn’t put the effort into mentioning realistic salaries while conducting her study.