The World Bank’s Human Capital Index, 2018 ranks India at 115 out of 157 nations. While there has been progress towards universalisation of elementary education and gains in broad indicators such as enrolment rates and student-teacher ratios, the quality of education continues to remain a black box. In this post, Bandyopadhyay and Agarwal discuss the key factors behind the deteriorating learning outcomes, with an emphasis on per-pupil expenditure, school infrastructure, and teaching.
The recently released Human Capital Index of the World Bank ranks India at 115 out of 157 nations under study. An interesting component of the Index is the ‘Harmonized Test Scores’ where India scores 355, well below the world average of 431. While the introduction of Sarva Shiksha Abhiyan1 (SSA) and Right to Education (RTE) Act, 2009 have contributed immensely to universalisation of elementary education, improvements in quality continue to remain a black box. With gains in broad indicators like enrolment rates and student-teacher ratios being well documented, we discuss the key factors behind the deteriorating learning outcomes, with an emphasis on per-pupil expenditure (PPE), school infrastructure, and teaching2.
According to the Annual Status of Education Report (ASER) (2015), learning outcomes – as measured by grade 3 and 5 reading- and mathematics abilities – have deteriorated for most states for over a decade until 2014. The possible underlying causes behind this worrisome phenomenon deserve fair attention.
State-level expenditure on education
Firstly, we look at the spending on education. Most of the expenditure on school education in India is undertaken by state governments. In Figure 1, using data from Reserve Bank of India’s Database on Indian Economy (DBIE), we compare state-level expenditure on education as a share of the state’s total expenditure in 2000-01 and 2016-17. Despite India’s growing young population, it is evident that, the share for most states fall below the 45-degree line reflecting a reduction in education expenditure.
Figure 1. State-wise share of education expenditure in total expenditure in 2000 and 2016
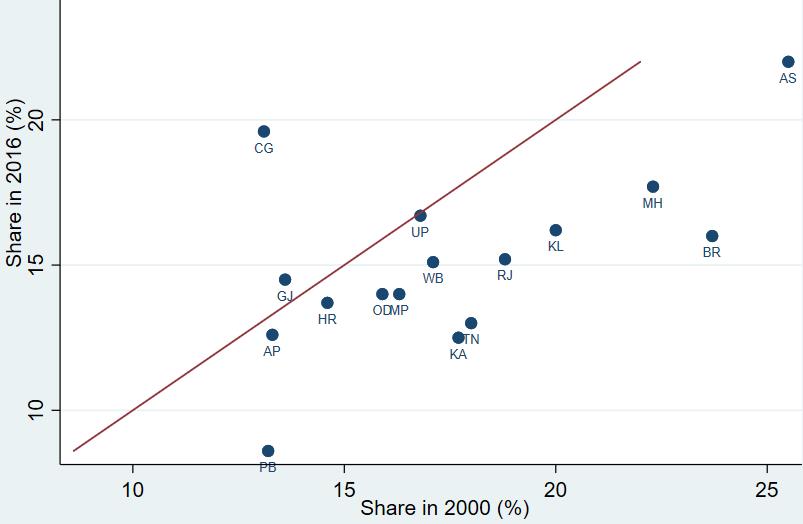
Note: AP – Andhra Pradesh, AS – Assam, BR – Bihar, CG – Chhattisgarh, GJ – Gujarat, HR – Haryana, KA – Karnataka, KL – Kerala , MH – Maharashtra, MP – Madhya Pradesh, OD – Odisha, PB – Punjab, RJ – Rajasthan, TN – Tamil Nadu, UP – Uttar Pradesh, WB – West Bengal.
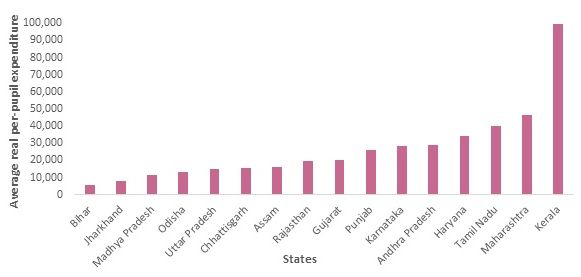
More importantly, we calculate the real per-pupil expenditure (RPPE) on education across states, using state-level CPI (consumer price index) data, available from 2010-11 to 2015-16 from the Ministry of Statistics and Programme Implementation. We deflate the nominal expenditure on education to get the real expenditures (base year 2010) and divide by the state-level enrolment in government primary schools available from DISE (District Information System for Education) state report cards 2010-2015. The average RPPE over the six-year period demonstrates considerable variation across states as shown in Figure 2: The figure for Kerala is more than 17 times that of Bihar.
Figure 2. Variation across states in average real per-pupil expenditure (2010–2015)
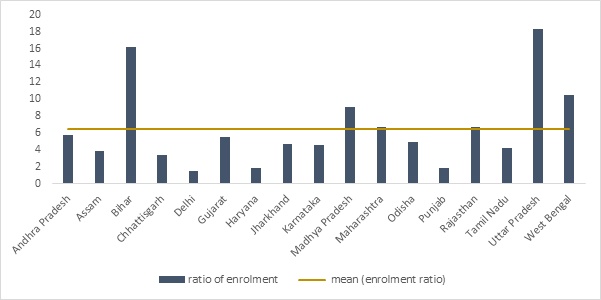
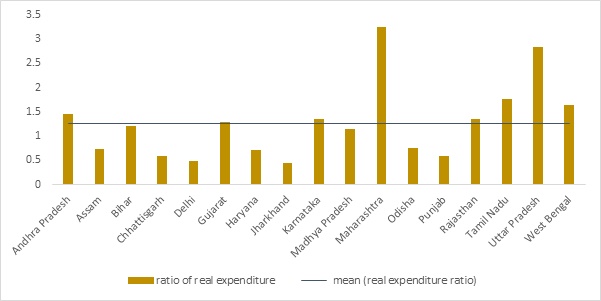
Such significant variation across states begs the question: what channels are driving these results? In Figure 3, we look at the components of RPPE separately. We take the best-performing state – Kerala – as the base against which we calculate the ratio of average real expenditure and average enrolment for all the other states. It is clear that while the enrolment rate in other states is, on average, 6.5 times that of Kerala, it is not compensated by a higher real expenditure, which is on average, merely 1.2 times that of Kerala. The situation is rather harrowing for the worst-performing state, Bihar, where enrolment is 16 times that of Kerala but real expenditure only 1.2 times. This suggests that the harmony between real expenditure and enrolment rates is lacking in the low RPPE states.
Figure 3. Comparing enrolment and real expenditure of all states with Kerala
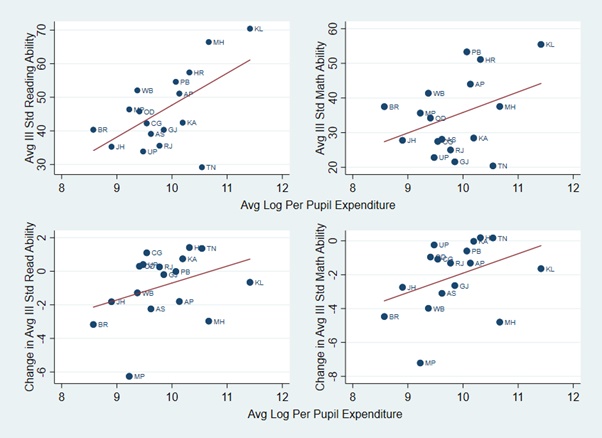
What is crucial, though, is whether higher RPPE translates into better learning outcomes. From Figure 4, it seems certainly the case. We find that for grade 3 students (same trend holds for grade 5) the average mathematics- and reading ability scores show a positive correlation with average RPPE over 2010-2014. The positive correlation also holds if we look at average changes in learning outcomes. It suggests that higher the RPPE on education in a state, the better the prospects for the state to improve its student learning outcomes.
Figure 4. Positive correlation between real per-pupil expenditure and learning outcomes
Source: ASER, DBIE, DISE.
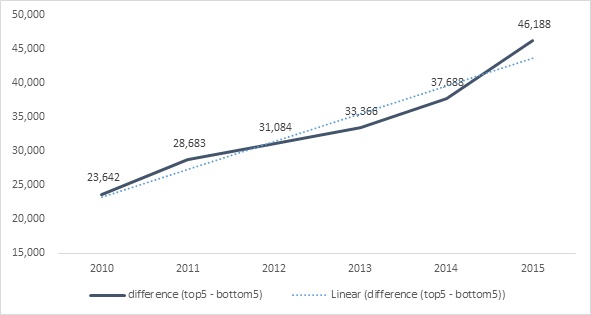
Another important aspect to consider is the time trend of RPPE, which we note in Figure 5. The figure plots the difference in average RPPE of the top-five and bottom-five states (from Figure 2) across years. The difference has increased unequivocally, in fact, doubling from below Rs. 23,000 in 2010-11 to over Rs. 46,000 in 2015-16. The increase in this gap shows that the worst-performing states are not making amends on the expenditure side, which presents a glum outlook for any future improvements in learning outcomes.
Figure 5. Difference in real per-pupil expenditure between top-five and bottom-five states across time
Status of school infrastructure and learning outcomes
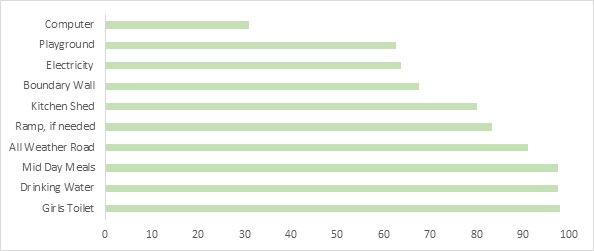
Next we investigate school infrastructure as a possible determinant of learning outcomes. Figure 6 shows the nation-wide performance of schools in 2016 in terms of several key amenities, with state populations used as weights, using data from DISE state report cards. The data show mixed results with facilities like girls’ toilets, mid-day meals, and drinking water reaching near-universal levels, but a large scope for improvement in some of the others. More than a third of the schools still lack access to electricity and less than a third have access to a computer. Similarly, more than a third of the schools do not have a playground or boundary walls. Additionally, these national-level statistics mask wide differences across states.
Figure 6. Status of school infrastructure in India, 2016
For instance, in terms of electricity in schools, six states including Punjab, Gujarat, and Kerala have near-universal coverage. On the other hand, there are six states in which less than half of schools have electricity, with Jharkhand being the worst performer with 15% of schools having electricity. Similarly, in terms of schools with computer facility, Kerala leads the pack with 94% coverage, while there are eight states with less than 15% coverage. We test if the status of infrastructure is correlated with learning outcomes in Figure 7, specifically focusing on percentage of schools with access to electricity. We find a clear positive correlation between grade 3 students’ average mathematics- and reading ability scores (levels and changes) and the availability of electricity (same trends hold for grade 5, and computer coverage).
Figure 7. Positive correlation between percentage of schools with access to electricity and learning outcomes
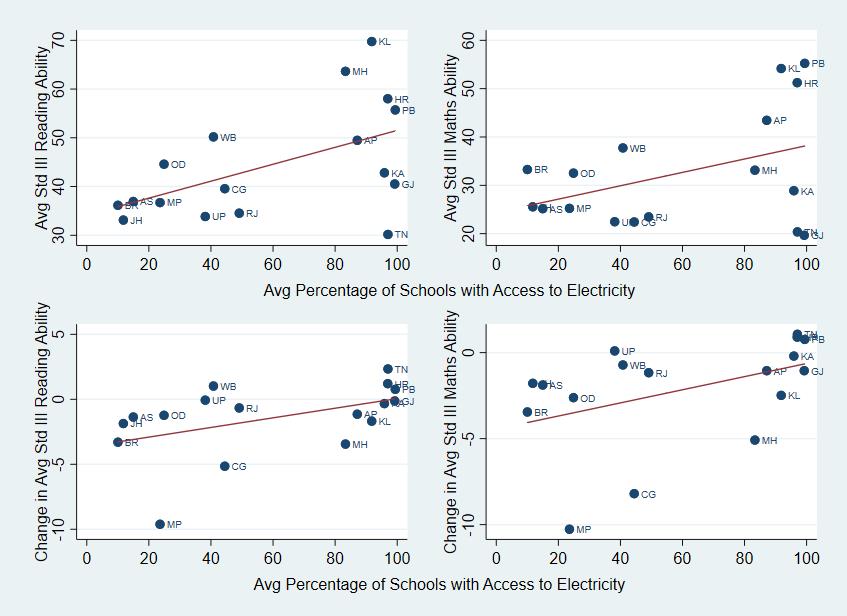 Note: Figures indicate grade 3 average reading- and mathematics abilities (levels and changes).
Source: ASER, DBIE, DISE.
Teaching
Coming to the teaching side, there are several aspects that deserve attention. India is clearly lacking in terms of teacher specialisation with over 100,000 schools being single-teacher schools, according to DISE. Furthermore, ex-ante, under-qualified teachers are not subjected to rigorous training during their initial tenure. The deadline to train teachers under the RTE Act, 2009 has already been extended from 2015 to 2019 due to the presence of 1.11 million teachers who are still untrained.
The high incidence of teacher absenteeism in India is a serious issue as shown by a Das et al. 2016. This World Bank working paper suggests that between 2003 and 2010 teacher absenteeism has fallen only marginally from 26.3% to 23.6%. In the worst-performing state, Jharkhand, teachers are absent nearly 46% of the times. The paper estimates the fiscal burden of absenteeism at around Rs. 81–93 billion.
The problems are worse for the public schools in rural areas. The system of checks and balances is often lax, and the teachers are often paid better than their private-school counterpart, sometimes even resulting in socioeconomic divide and biases between teachers and the poor students.
Concluding remarks
As the positive impact of higher expenditure and better infrastructure on learning is evident, the Central and state governments can work together to ramp up spending on education, which is currently hovering around the 3% of GDP (gross domestic product) mark. India is the worst-performing country in this regard amongst the BRICS (Brazil, Russia, India, China, and South Africa) nations (BRICS Statistics, 2017). Some Indian states – most noticeably Delhi – have taken steps by almost doubling the budget on education and infrastructure spending in schools.
In terms of teacher training, India has a long way to go. It can learn from countries like Singapore – global leader in education outcomes – which requires teachers to undergo 100 hours of compulsory training annually to stay updated with the latest technology and curriculum.
Furthermore, targeting student performance at the entry level is also crucial. Humans are prone to forming internal benchmarks while performing a new activity. When students performs well in their first few exams, they subconsciously create benchmarks against which future performance is self-evaluated. The fear of falling short often motivates students to perform to their full potential.
However, we need to remember that changing the entire landscape of education in the country will surely take time. There is no magic wand that will improve education outcomes overnight.
Notes:
- Sarva Shiksha Abhiyan (SSA) is Government of India's flagship programme for achievement of universal elementary education as mandated by the 86th amendment to the Constitution of India – making free and compulsory education to the children of 6-14 years age group, a fundamental right.
- We have analysed data on the 17 largest Indian states, by population. Primary data sources include Annual Status of Education Reports (ASER), District Information System for Education (DISE) state report cards, Ministry of Statistics and Programme Implementation (MOSPI), and RBI’s Database of Indian Economy (DBIE). Based on availability, we have used data between 2000 and 2016.
Further Reading
- ASER (2015), ‘Trends Over Time 2006-14: A supplement to ASER 2014’, ASER Centre, New Delhi.
- BRICS Statistics (2017), ‘BRICS Joint Statistical Publication 2017’.
- Muralidharan, K, J Das, A Holla and A Mohpal (2016), ‘The fiscal cost of weak governance: Evidence from teacher absence in India’, Policy research working paper no. WPS 7579, The World Bank, Washington DC.
- Stewert, V, ‘How Singapore Developed a High-Quality Teacher Workforce’, Asia Society, Global Cities Education Network, Center for Global Education.
- World Bank Group (2018), ‘The Human Capital Project’, Washington DC.


 10 December, 2018




Comments will be held for moderation. Your contact information will not be made public.