

 10 October, 2022


In the first post of a six-part series on the estimation of poverty in India, Surjit Bhalla and Karan Bhasin discuss issues related to measurement of absolute poverty in India. They summarise their IMF working paper from April 2022, and defend their assumption of unity pass-through and impact of food transfers. They point out shortcomings in certain measurement approaches, including the World Bank’s reliance on the outdated Uniform Recall Period, and cite other poverty estimates which corroborate their own findings.
It needs no emphasis to assert that, economically, how a developing country has ‘performed’ is inextricably tied to its performance in poverty reduction. This issue was examined in great detail in a recent IMF working paper by Bhalla, Bhasin and Virmani (hereafter BBV). In this article, we explore several issues related to absolute poverty in India: measurement, definition, and performance.
Mismeasurement of poverty in India has been rampant because of two major reasons – measurement (led by the World Bank) has concentrated on the wrong definition of consumption expenditure (often regarded as the measuring rod of poverty), and on the wrong interpolation of survey expenditures for the years when a consumer expenditure survey was not undertaken. This happens all too often in many countries – developed, and especially, developing. The correct definition and measurement, in survey data for the consumer expenditure years of 2009-10 and 2011-12, leads to an estimate of poverty that is 10 percentage points less than the measure used by the World Bank! Further, an innovative departure in our paper is to incorporate in-kind food transfers in consumption expenditure and poverty.
Indian data on consumption and derived poverty
Most countries undertake either an income or a consumption expenditure survey at regular intervals to help better understand their progress towards poverty alleviation. No developing country undertakes a survey on an annual basis, and therefore there are various methods that are deployed to fill in the gap in poverty estimates for non-survey years.
In India, the last available Consumer Expenditure Survey (CES) is from 2011-12. There was a subsequent CES conducted in 2017-18 which was withheld by the government due to data quality issues.1 Some findings of the survey were available from leaked reports, and based on these reports we can safely conclude that the 2017-18 CES did have serious data quality problems. As we show in detail in our paper (Bhalla, Bhasin and Virmani 2022), the CES 2017-18 survey data was grossly inconsistent with other available survey and administrative data on consumption. Our findings are further supported by World Bank authors Edochie et al. (2022) who find little evidence of a decline in real consumption between 2011 and 2017 as indicated by CES 2017-18; indeed, their best estimates for 2017-18 are close to ours – they find a national poverty rate of 9.9% in 2017, with a 95% confidence interval2 of between 8.1 and 11.3%, and a poverty rate of 10.4% (with a confidence interval between 10.0 and 10.8%) using the World Bank preferred pass-through rate of 0.67.
Any poverty estimation exercise post 2011-12 has to be conducted without the use of the 2017-18 survey. We follow the same procedure as followed by the World Bank to estimate poverty when survey data are not available – which happens often. Briefly, the procedure is to take the last available distribution (in this case 2011-12) and estimate annual means through the growth in National Accounts (NA) estimate of per capita Private Final Consumption Expenditure (PFCE) with the last consumption distribution as the base. We demonstrate that conventional methods of estimating poverty underestimate consumption expenditures (and therefore over-estimate poverty) because they do not make explicit adjustments for in-kind transfers. We also look at the expansion of India’s food security programme, and highlight the key role played by this expansion during the pandemic.
Importance of updating recall periods
It is almost redundant to emphasise the importance of definitions in poverty measurement. The World Bank (often considered to be the gold standard of poverty measurement) has different defined lines of poverty for different stages of development (that is, per capita expenditure level of $1.90 per person per day for low-income countries, $3.20 and $5.50 for middle-income countries, and $21.7 for high income economies). With revisions to purchasing power parity (PPP) estimates, the poverty line definition also changes (for example, according to the 2005 International Comparison Program (ICP) survey, the extreme poverty line was deemed to be $1.25 in 2005 prices; with the 2011 base, the extreme poverty line is estimated to be PPP $1.90 per person per day).
Given the stress on the ‘correct’ definition, it is peculiar that the World Bank continues to use an outdated definition of consumption expenditures. Since the first CES in 1951, the Indian government has measured household expenditures on a 30-day recall basis (Uniform Recall Period, or URP). With the passage of time and development, the Indian government (and the World Bank) realized that a more accurate estimate of consumption expenditures could be obtained by different recall periods for different items of consumption. An expanded consumption survey with a Mixed Recall Period (MRP) began in 1983, and was finalised in 1993-94. Almost 20 years post this change, the government (in the Tendulkar Committee Report (2009)) adopted this as the official method of measuring expenditures. Interestingly, the Tendulkar Report makes no mention of the existence of the URP method. Yet, given a 20-year historic track record of estimates for the more accurate MRP method, the World Bank has continued with the obsolete URP method of measuring poverty.
In both the 2009-10 and 2011-12 consumer surveys, the government experimented with a third method of collecting information on household expenditures – the Modified Mixed Recall Period (MMRP) method. MMRP differed from MRP, with perishables (fruits and vegetables) consumption being measured based on seven-day recall. Incidentally, both the Indian Planning Commission (the erstwhile Indian body in charge of poverty estimates) and World Bank reports (Deaton and Grosh 1998) had consistently recommended this change. The acceptance of MMRP became final when the 2017-18 survey only contained estimates according to the MMRP method.
Yet, to date, the World Bank has refused to change its use of the URP method. Note that the World Bank can estimate poverty post 2011-12 just as easily, and ‘accurately’ by using the 2011-12 MMRP estimates, as it does through the use of the base year URP estimates.
In our paper we provide both sets of estimates. The adjustment is not small. In 2011, the URP based method leads to a national poverty estimate of 21.8% while the MMRP leads to a poverty estimate of 12.2%. Stated differently, the MMRP leads to an estimate of poverty that is almost half that obtained from the obsolete URP method. The accuracy of the estimates matter for both government programmes geared towards poverty alleviation, and international comparisons of countries’ performance in reducing poverty.
The validity of the PFCE pass-through approach
Given the correct definition of expenditures (MMRP), and base year (2011-12) estimates of the distribution, we obtain for each person the predicted level of expenditures based on per capita PFCE growth. This approach has been criticised by some who argue that PFCE consumption growth and survey per capita consumption growth need not be the same (some mistakenly make the observation that we use PFCE levels to estimate poverty!) We follow the method used by the World Bank – when survey data are not available, it assumes growth to be equal to PFCE growth. However, unusually, and without adequate explanation, the World Bank uses a pass-through3 factor of 1 for all countries and 0.67 for India.
According to section 5.1.1 of the World Bank’s Poverty and Inequality Platform Methodology Handbook, “India is the only case where the pass-through methodology is applied. The latest available survey for India is from 2011/12. Poverty for India after 2011/12 is calculated using the extrapolation method […] with a national accounts growth rate adjusted for a pass-through rate.”
A pass-through of less than 1 for India has the obvious consequence of over-estimating Indian poverty, and given the size of its population, over-estimating world poverty.
As documented in Figure 1, the assumption of a pass-through of 1 for India is consistent with historical survey data for India. On average, since 1973, growth in survey expenditures has been approximately equal to 89% (a pass-through of 0.89) of PFCE growth. Our assumption of unity pass-through appears correct, especially given the fact that the assumed pass-through factor by the World Bank is unity for all other countries.
Figure 1. Average PFCE to survey pass-through for India, from 1977-78 to 2011-12
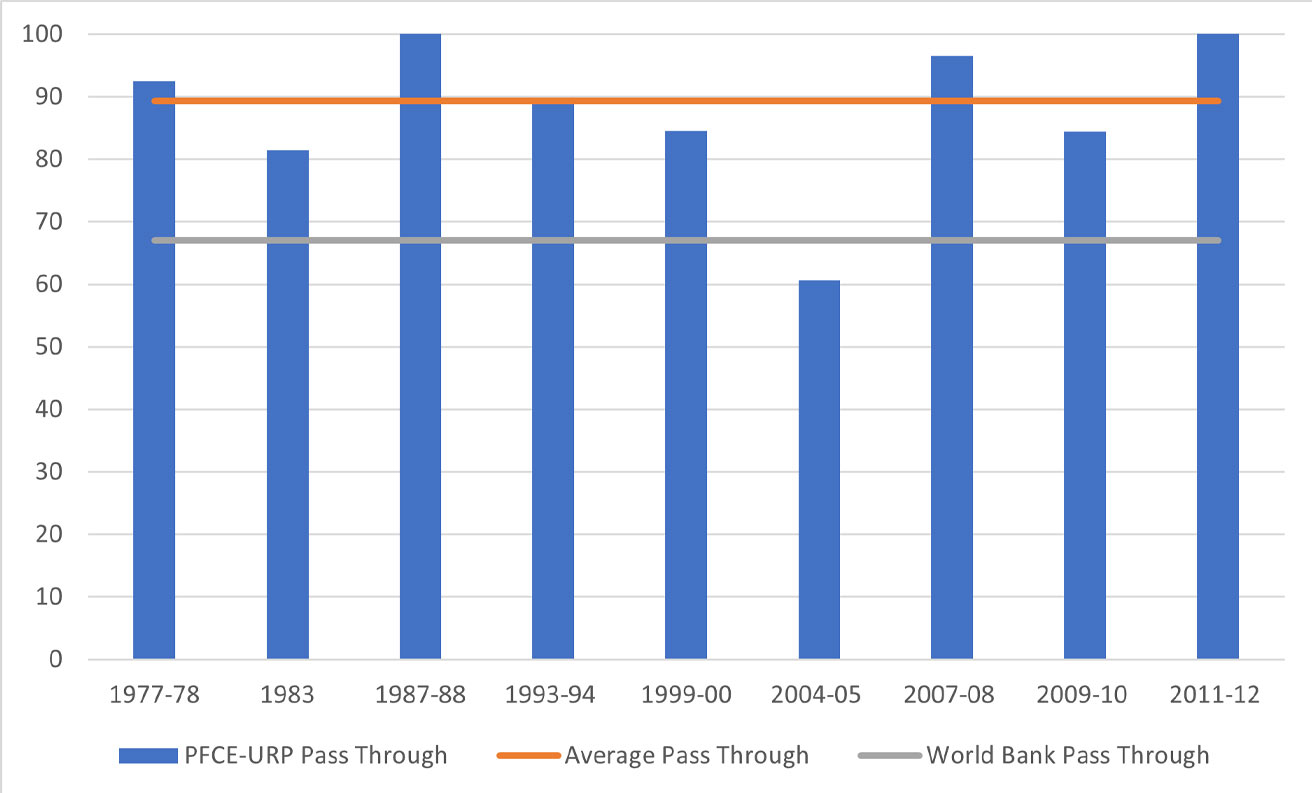
Source: NSS Consumption Expenditure Surveys and National Accounts data
Note: The horizontal lines represent the average pass-through rate of 0.89 (as calculated from historical survey data) and the pass-through rate of 0.67 assumed by the World Bank.
Additional confirmation of a unity pass-through post 2011-12 is obtained through the estimate of survey growth in National Council of Applied Economic Research’s (NCAER) India Human Development Survey (IDHS) for three poor states – Bihar, Uttarakhand and Rajasthan. The IHDS recorded real consumption growth of 34% between 2011 and 2017, while real PFCE growth was a lower 31% – that is, a pass-through level equal to 1.1.
Further, as shown by Bhalla and Motheram (2022), the pass-through on the basis of 66 consumption items covered in the 2014-15 expenditure survey, on durables and services consumption, was considerably higher than unity. For these items (which accounted for 13% of total consumption in 2011-12) the average nominal growth was 75%, compared to 42% for all PFCE items. If one adds food in restaurants as covered in 2014-15, the growth is 79%. If one adds information on health and education for 20144, aggregate growth in survey consumption was close to 88% – all together, a pass-through of more than 2 (88 % compared to 42%). Specialised surveys lead to deeper uncovering of consumption; nevertheless, such a large additional uncovering in the 2014 consumption surveys is surprising and revealing.
Such a large pass-through in 2014-15 suggests that our estimate of unity pass-through for the years 2011-12 through 2020-21 is a conservative one. These results of the 2014-15 NSSO survey also suggest that the out-of-line-ness of the non-released 2017-18 survey is also considerably greater than previously thought.
Further support for our estimates is found in URP based poverty estimates as obtained by World Bank studies by Newhouse and Vyas (2018) and Edochie et al. (2022). Both studies use different methods, including the PFCE pass-through approach and the survey-to-survey imputation technique, to arrive at poverty estimates. Table 1 provides various poverty estimates for comparison.
Table 1. Extreme or absolute poverty in India from 2011 to 2020
2011 |
2014 |
2017 |
2019 |
2020 |
|
in % |
|||||
Without food transfers |
|||||
MMRP |
12.2 |
7.4 |
2.9 |
1.4 |
2.5 |
URP |
21.8 |
14.6 |
7.2 |
3.4 |
6.1 |
With food transfers |
|||||
MMRP |
10.8 |
5.1 |
1.9 |
0.8 |
0.9 |
URP |
19.9 |
10.9 |
4.6 |
1.9 |
2.1 |
World Bank estimates |
|||||
Newhouse and Vyas (URP) |
14.6 |
||||
Edochie et al. (URP) |
10.4 |
||||
Source: Bhalla, Bhasin and Virmani (2022)
Notes: i) The poverty line is defined as $1.9. ii) Poverty estimates are a percentage of population. iii) The highlighted figures indicate instances where BBV’s estimates using the URP method were identical or very close to estimates observed by other researchers.
What is noteworthy is that two very different methods (ours, using the survey in 2011-12 and PFCE growth estimates post 2011-12) and Newhouse and Vyas (using two household surveys, 2011-12 and 2014-15, and a survey-to-survey imputation technique) yield the same estimate of poverty in 2014-15. Further, our estimate for poverty in 2017-18, at 7.2% is very close to the average of estimates arrived at by Edochie et al. – 10.4%
In-kind transfers and their impact on poverty measurement
The central focus of our paper was to estimate poverty during the pandemic and study the impact of the expansion of the Public Distribution System (PDS) food transfer programme on poverty. In-kind transfers must be accounted for, as these transfers raise the consumption expenditures for the beneficiaries to a level above that of reported consumption expenditure, and hence result in a more accurate (and lower) poverty estimate. In contrast, cash transfers are transfers of income which are then spent by households, and are therefore captured by a conventional consumption survey.
The distribution of PDS consumption for 2004-05 and 2011-12 is obtained through unit-level data for the two years. The National Sample Survey Organization’s surveys document the consumption (both value and quantity) of PDS and market purchase data for each household. With availability of both administrative data (quantity of PDS food grains delivered to households) and household data (PDS consumption received by households) one can easily estimate the targeting efficiency– that is, the proportion of food grains received as a ratio of food grains deemed to have been delivered by the government. The targeting efficiency averaged 25% in 2004-05; in 2011-12, this average had doubled to 50%. We assume an improvement in targeting, which is in line with the recorded improvement for PDS consumption post 2014-15. This yields an estimate of targeting at 86% post 2013-14 – that is, eligible households only received 86% of PDS grains.
The expansion of the Pradhan Mantri Garib Kalyan Yojana (a supplement to PDS) became a major component of the support extended to the poor during the pandemic. Our targeting estimate of 86% can be corroborated by various other surveys and studies such as Bhattacharya and Roy (2021), who looked at India’s social protection response to Covid-19 using the Consumer Pyramid Household Survey (CPHS) carried out by the Centre for Monitoring Indian Economy. They find that 80% of all households received at least one form of social protection benefit. The NCAER’S Delhi Metropolitan Area Study found that the PDS increase during the pandemic was substantial.5 Gelb et al. (2021) from the Center for Global Development find that the “PDS played a central role; the fact that 91% of eligible households reported receiving food support during an unprecedented lockdown is a notable achievement.” This is a higher targeting efficiency of 91%, as compared to 86% as assumed by us).
Conclusion
In conclusion, taking into account food transfers, and the correct definition of consumption expenditures (MMRP), we find that extreme poverty in India was less than 1% in both 2019-20 and 2020-21. A useful reminder on the importance of using the right definition and correct measure of poverty, is provided by the following example. China, despite a PPP per capita level of income that is 2.6 times higher (and per capita dollar income that is 5.4 times higher) than that of India, reached this same level of poverty elimination (less than 1% extreme poverty) in 2016, just four years before India.
Notes:
- This rejection of survey data is not without precedent. The 1987-88 NSSO Employment and Unemployment survey had severe data quality issues, and does not appear in any review or analysis of employment in India. Consumer Expenditure Surveys are generally conducted with a five-year gap; yet because 2009-10 was deemed a drought year, the government scheduled a new consumption survey in 2011-12.
- A 95% confidence interval means that if you were to repeat the study over and over with new samples, 95% of the time the calculated confidence interval would contain the true effect.
- A pass-through rate, or the fraction of PFCE growth captured in household surveys, can also be used as the scaling factor to estimate growth of consumption for years when consumption survey data doesn’t exist.
- From separate NSSO surveys in 2014-15.
- The panel survey was from four states - Delhi, Uttar Pradesh, Rajasthan, and Punjab.
Further Reading
- Bhalla S S, K Bhasin and A Virmani (2022), ‘Pandemic, Poverty, and Inequality: Evidence from India’, International Monetary Fund, IMF Working Paper No. 2022/069.
- Bhalla SS, and A Motheram (2022), ‘Matching Survey and National Accounts Growth – Evidence from India”, Forthcoming.
- Bhattacharya S and SS Roy (2021), ‘Intent to Implementation: Tracking India’s Social Protection Response to COVID-19’, World Bank, Discussion Paper No. 2107.
- Deaton, A and M Grosh (1998), ‘Chapter 17: Consumption’ in M Grosh and P Glewwe (eds.), Designing household survey questionnaires for developing countries lessons from ten years of LSMS experience. Available here.
- Edochie, I, et al. (2022), ‘What do we Know about Poverty in India in 2017/18?’, World Bank, Policy Research Working Paper 9931.
- Gelb, A, et al. (2021), ‘Social Assistance and Information in the Initial Phase of the COVID-19 Crisis: Lessons from a Household Survey in India’, Center for Global Development, Policy Paper 217.
- Newhouse, DL and P Vyas (2018), ‘Nowcasting poverty in India for 2014-15: A survey to survey imputation approach’, World Bank, Global Poverty Monitoring Technical Note 6.
- Roy, SS and R van der Weide (2022), ‘Poverty in India Has Declined over the Last Decade But Not As Much As Previously Thought’, World Bank, Research Working Paper No. 9994.

Comments will be held for moderation. Your contact information will not be made public.