

 05 March, 2017


Analysis of National Sample Survey data shows that low rates of female labour force participation in India are concentrated among married women in rural areas. This column suggests that this is partly because women with medium levels of education choose to spend more time on child care and domestic work.
Tweet using #womenandwork
Globally, about half of all women work, and recent increases in rates of female labour force participation have contributed to a falling gender gap in employment in many countries. Yet, in India, trends in women's participation in the market economy are moving in the opposite direction. Despite a rapid fertility transition, broad increases in women's educational attainment, and substantial economic growth over the past two decades, the share of Indian women working has fallen over time. Currently, only about one-third of India's half a billion adult females report being part of the labour force. These low rates of female employment and declining trends in women's labour force participation rates are potential causes for concern, because market work for women is often associated with their better access to economic opportunities and with greater decision-making power within the household. From a macroeconomic perspective, low rates of market work among women also imply a significant underutilisation of labour resources in the economy.
Why might Indian women be defying global trends in female labour force participation, when many of the factors that are thought to facilitate women's market work are improving over time? In a recent International Growth Centre (IGC) study (Afridi, Dinkelman and Mahajan 2016), we use three rounds of Indian National Sample Surveys (NSS) from 1987 to 2011 to show that low rates of female labour force participation are concentrated among married women working in rural areas, where the majority of Indian women reside. We highlight that low female labour force participation is not a new phenomenon and that recent decades have seen further real reductions in these employment rates. Then, we examine whether changes in observed demographic and socioeconomic characteristics of females can account for the fall in their labour force participation rates in and between 1987-1999 and 1999-2011.
Married women in rural India are shifting out of market work over time
In Figure 1, we show labour force participation rates (LFPR) over time by gender and urban/rural area, for the sample of adults aged 25 to 65. Men work at substantially higher rates than women, and rural women work at higher rates than urban women. Strikingly, rural Indian women experience the largest declines in LFPR over time1. In 1987, their LFPR was around 55%; by 2011, only 44% were working in the market. Figure 2 shows that within the sample of rural women, those who are married drive the overall decline in women's LFPR. To what extent can changes in individual and household characteristics account for these changes in the labour force participation of married women in rural areas over time?
Figure 1. Labour force participation rates (LFPR) over time by gender
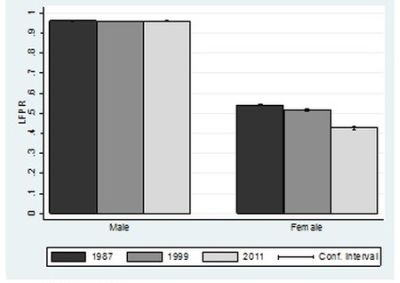
(a) Rural
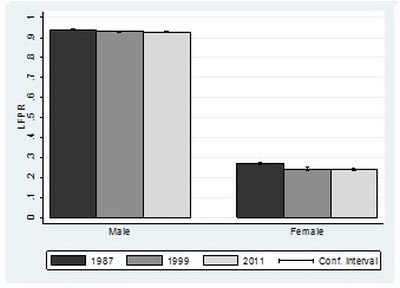
(b) Urban
Source: Afridi, Dinkelman and Mahajan (2016).
Note: Figure uses Indian National Sample Survey (NSS) data (1987, 1999, 2011), Employment and Unemployment Schedule.
Figure 2. Female LFPR over time by marital status
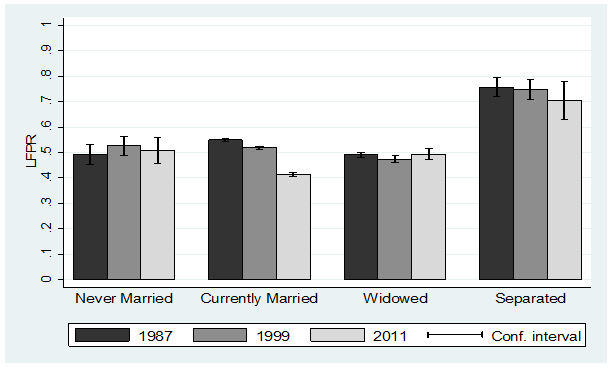
Source: Afridi, Dinkelman and Mahajan (2016).
Note: Data used are from the Indian NSS (1987, 1999, 2011), Employment and Unemployment Schedule. Sample includes rural women aged 25-65.
Increasing levels of education are associated with declining rates of female LFP
We divide these changes in female LFPR over time into the part that can be accounted for by changes in observable characteristics, and the part that can be accounted for by changes in the returns to these characteristics2. We do this to understand how much of the decline in female LFPR over time is driven by women becoming more like the types of individuals that have low employment rates.
Our results reveal three broad patterns:
- Changes in individual attributes (like increasing education levels and changing age distributions) and household factors (like increases in household wealth and improvements in men's level of education) fully account for the fall in women's labour force participation between 1987 and 1999.
- Changes in these variables account for a much smaller share (just over half) of the decline in LFPR between 1999 and 2011. We do not find strong evidence that observable variables correlated with social stigma against women working outside the home (example, caste, religion) can account for a substantial proportion of the fall in women's LFPR in either period.
- Increasing levels of education among rural married women and the men in their households are the most prominent attributes contributing to the decline in LFPR in both decades.
Why should more women's education contribute to lower rates of LFP? Figure 3 shows a U-shaped relationship between women's education and their participation in the labour market. As women move from being illiterate to having primary and middle levels of schooling, LFPR falls. LFPR only start to rise as education increases to completed secondary schooling and to the graduate level. Over the last three decades, women in rural India have gained enough education to move younger cohorts from illiteracy to low and middle levels of education. But, in contrast to urban areas, schooling in rural areas has not yet expanded enough to pull most women through completed high school or further, into graduate education. Figure 3 suggests that human capital improvements may not yet have reached sufficiently high levels for women to earn high enough returns in market work in rural India3.
Figure 3. Female LFPR over time by education level
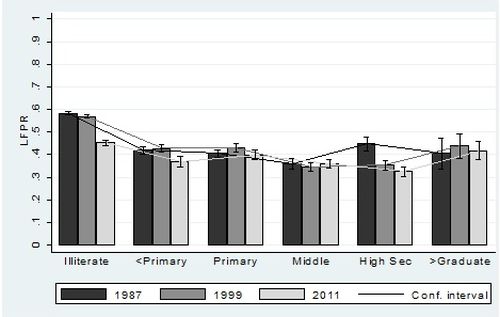
Source: NSS (1987, 1999, 2011), Employment and Unemployment Schedule.
Note: The sample includes women aged 25-65 in rural India. ‘High Sec' refers to secondary and higher secondary level of education. Bars show averages of LFPR by level of education for each NSS survey year by education category. The lines connect the averages across education categories.
Part of the puzzle: Are rural women with some education doing more at home than in the market?
What are these married women in rural India doing, if they are not in the labour force? One hypothesis is that even with more education and fewer children, rural women's time may be relatively more valuable in home production. This could be because women are objectively more productive at home with higher levels of education, or because men or women's preferences for home relative to market work change with more education.
In Figure 4, we show that the decline in rural married women's LFPR has been accompanied by an almost equivalent increase in the proportion of women who report domestic work as their primary activity in the past reference year during 1987-2011 (from 55% in 1987 to 69% in 2011). Other results suggest that the decline in the LFPR of women aged 25-40 was larger than the decline for 40-65-year-olds in both decades. These younger cohorts are most likely to have children of school-going age – almost twice as many 6-14-year-old children as women aged 40-65 - in the NSS, and therefore most likely to experience high returns to child care in the home.
Figure 4. Female participation in domestic work over time by marital status
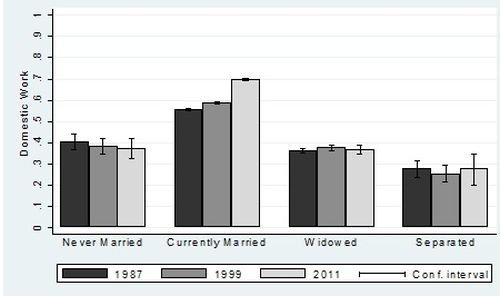
Source: NSS (1987, 1999, 2011) Employment and Unemployment Schedule (Authors' calculations).
Note: The sample includes women aged 25-65 in rural India. The above graph reports proportion of women whose primary activity is domestic work.
We explore the relationship between education and time spent on child care and other household activities using time-use data from the 1998 Indian time-use survey. Figure 5 shows distinct increases in women's time spent in child care and other chores at higher levels of education, up to higher secondary schooling. More education, at least up to primary, middle, and upper secondary school, implies more work in the home for mother.
Findings from other research give some reason to think that more education makes women's time in the home more valuable. First, returns to education in home production may have increased during the period of our study because returns to children's human capital were rising. In earlier periods, researchers have shown that returns to investing in male education in India increased after the introduction of green revolution technology (Behrman et al. 1999) and this in turn increased the demand for educated women in the marriage market. Women with primary education spent more time at home and the presence of an educated mother increased time spent by children studying, relative to less educated mothers. Similar mechanisms could be at work during the 1987-2011 period, when labour market returns to higher levels of education (high school and above) have been increasing (example, Azam 2012, Mendiratta and Gupta 2013, and Kharbanda 2012).
Second, the cross-sectional evidence (from the year 1998) in Figure 5 is in line with broad patterns in some other parts of world like Brazil (Lam and Duryea 1999) where dramatic improvements in female education and reductions in family size only translated into more market work once women attained more than eight years of education. Taking all of our descriptive evidence together suggests a compelling explanation for why women's LFPR in rural India has declined over time. As women (and men) get more education and poverty rates have fallen, the gap between returns to home production versus returns to market work has grown larger. Future research could usefully try to quantify the changing relative returns to market and home production for Indian women.
Figure 5. Female time spent in child care and other household chores, by education level
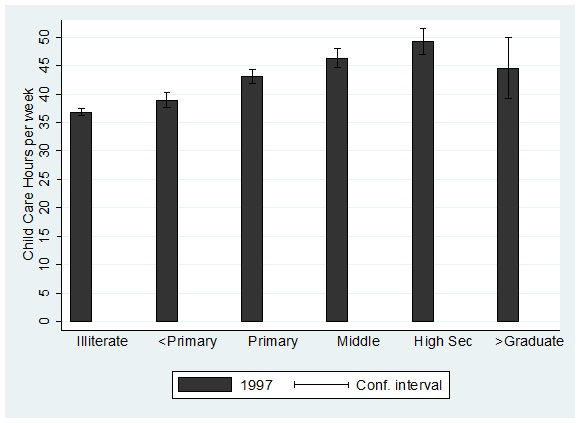
Source: Author's calculations from the 1998 Indian Time Use Survey.
Note: Figure plots hours spent in a week on exclusive child care and other domestic chores, which indirectly add to children's well-being or can be done while supervising children. This includes time spent on cooking and cleaning house, washing clothes and utensils, along with the activities in exclusive child care. Child care includes physical care of children (washing, dressing, feeding), teaching training and instruction of own children, accompanying children to doctor/school/sports/other, supervising children, travel related to care of children. ‘High Sec' refers to secondary and higher secondary level of education. The sample is of rural, married women aged 25-65 living with at least one child aged 0 to 15. The total number of observations is 7,593.
Conclusion
India has experienced large improvements in levels of education, falling fertility rates, and increasing incomes across the income distribution since the late 1980s. Somewhat surprisingly in this context, rural women in India have removed themselves from the labour market at increasing rates over time. Our analysis suggests that increasing levels of education for men and women have an important factor accounting for this decline. Part of understanding why this is the case is related to the observation that women with medium levels of education choose to do more domestic work, and spend more time on child care and home production. Overall, our descriptive analysis suggests that, relative to urban women, rural women in India may still be on the downward sloping part of the U-shaped curve of female LFP.
Notes:
- In related work, Klasen and Pieters (2015) focus on female LFPR in urban areas. They find consistently low (rather than declining) LFP over similar time periods.
- We use both parametric (Blinder-Oaxaca) and semi-parametric (Dinardo-Fortin-Lemieux) decomposition techniques.
- The percentage of illiterate women in the sample of 25-65-year-old rural married women has fallen from 80% to 54% during 1987-2011. On the other hand, the percentage of primary and middle educated females has increased from 10% to 23%, and that of higher secondary has increased from 2% to 9%. The relative starting position of rural and urban women on the U-curve may therefore account for the different relationships between education and changes in female LFPR between urban (Klasen and Pieters 2015) and rural areas (this paper).
Further Reading
- Afridi, F, T Dinkelman and K Mahajan (2016), ‘Why Are Fewer Married Women Joining the Work Force in India? A Decomposition Analysis over Two Decades', IZA (Institute for the Study of Labor), Discussion Paper No. 9722.
- Azam, Mehtabul (2012), “Changes in wage structure in urban India, 1983–2004: A quantile regression decomposition”, World Development, 40(6):1135-1150.
- Behrman, Jere R, Andrew D Foster, Mark R Rosenweig and Prem Vashishtha (1999), “Women´s schooling, home teaching, and economic growth”, Journal of Political Economy, 107(4):682-714. Available here.
- Klasen, Stephan and Janneke Pieters (2015), “What explains the stagnation of female labor force participation in urban India?”, The World Bank Economic Review, 29(3):449-478. Available here.
- Kharbanda, V (2012), ‘Returns to education in India', Mimeo, University of Iowa. Available here.
- Lam, David and Suzanne Duryea (1999), “Effects of schooling on fertility, labor supply, and investments in children, with evidence from Brazil”, Journal of Human Resources, 34(1):160-192. Available here.
- Mendiratta, Priti and Yamini Gupt (2013), “Private returns to education in India by gender and location: A Pseudo-Panel Approach”, Arthaniti, 12(1-2)/2013/48.

Comments will be held for moderation. Your contact information will not be made public.