

 27 April, 2016


As the MDGs gave way to the SDGs, considerable attention has been focussed on movements in key welfare indicators for women and children in the past decade. In this context, this column compares India with Bangladesh, and also looks at the relative performance of Indian states. Further, it provides evidence on the strength of association between the quality of governance and welfare outcomes in India.
Both the Millennium Development Goals (MDGs) and the Sustainable Development Goals (SDGs) have targeted significant improvements in the welfare of women and children. As the MDGs gave way to the SDGs, considerable attention has been focussed on movements in key welfare indicators for women and children in the past decade. This is particularly true for India as it lags behind several of its poorer South Asian neighbours on various welfare indicators, despite impressive macroeconomic performance (Drèze and Sen 2013).
In this column, we provide evidence on the following questions: (a) how do India and Bangladesh1compare on some of the key indictors in MDGs relating to women and children in the past decade? (b) How do the states in India fare relative to one another over this period, and has there been much movement in the state rankings? (c) Do the women and child development indices move together as one compares the performances of states, and what is the strength of association between them and the quality of governance?
The period considered spans between 2005-06 and 2013-14. The data and related information are sourced from the National Family Health Survey (NFHS); the Rapid Survey on Children (RSOC); Demographic Household Surveys (DHS) of Bangladesh; and Indian Census data on gender disparity in literacy rate of 15-24 years and child mortality rates by different age groups in 2013-14. The ranking of the Indian states based on the quality of governance was obtained from Mundle et al. (2012). Note that, as Mundle et al. (2012) state, there are several alternative measures of governance. Their measure uses a "statist definition which equates governance with what governments do." and is based on the idea that "Good governance implies that authority must be deployed, and even necessarily based on, a larger purpose - the good of the people being governed." This definition is useful in the present context where the success of governance is assessed in terms of actual outcomes of women and child welfare. Since the dimensions that determine the 'governance performance index' include infant mortality rate (IMR), maternal mortality rate (MMR), and life expectancy at birth, Mundle et al. (2012) recognise the possibility that "a higher value of some indicator of governance may simply be attributable to the higher level of development of the State". To avoid this possibility, they carry out an elaborate five-step procedure "to isolate the quality of governance independent of the state of development."
India vs. Bangladesh
Table 1 below compares India and Bangladesh on selected indicators on women and child welfare2. In general, though India scores higher than Bangladesh on several country-level governance indicators, Bangladesh reported better outcomes than India on several of our chosen welfare indicators at the beginning of the period of analysis. The welfare indicators include percentage of 'wasted'3children, ratio of literate women to men in the 15-24 years age group, under-five mortality rates and IMR, and child immunisation. In the new millennium, Bangladesh continues to outperform India in terms of gender equality in youth literacy, with record improvement that makes it quite unique among developing countries. India does considerably better on women's antenatal care and births attended by skilled health personnel.
The comparative record is therefore mixed though overall India's progress has been superior to that of Bangladesh.
Table 1. Targets and indicators of MDGs, India vs. Bangladesh
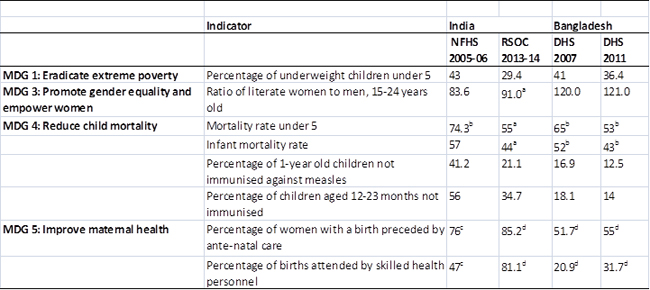
a. Rates are based on India Census 2011.
b. Rate refers to 0-4 years preceding the survey; expressed in terms of deaths per 1,000 live births.
c. Rate refers to live births five years preceding the survey.
d. Rate refers to live births three years preceding the survey.
Indian states
Comparative statistics for Indian states on a range of women and child welfare indicators are presented in Table 2 (2005-06) and Table 3 (2013-14) below. Similar to the Human Development Index (HDI), we construct unweighted averages of these measures, called the Child Development Index (CDI) and Women Development Index (WDI), and rank the states in descending order of outcomes, with 1 denoting the best and 17 the worst state. The ranks based on CDI and WDI - CDIR and WDIR - are presented in the last two columns of the tables respectively.
Tables 2 and 3 confirm the wide variation across states on nearly all the indicators with the southern states of Kerala and Tamil Nadu faring well on most outcomes, while Uttar Pradesh (UP), Madhya Pradesh (MP), Jharkhand and Bihar are at or near the bottom. India has a poor record in child immunisation; although progress has been made in almost all states, there is still a long way to go with nearly one in three children, sometimes even one in five children, not immunised at the end of the period of analysis. The picture also looks quite dismal in terms of child wastage and IMR. Even in the highly ranked southern states of Kerala and Tamil Nadu, nearly one in five children are wasted at the end of the analysis period, with the rates of wasted children rising to 35% or a more alarming 40% in several of the economically laggard northern states. Two areas where most states record reasonably satisfactory progress are antenatal care and child birth being attended by skilled personnel. States with dismal record on antenatal care, child birth being attended by skilled personnel, and child wastage, are also the ones with high under-five mortality rates and IMR. The state rankings point to a north (low ranked)-south (high ranked) divide, with an affluent state such as Gujarat performing quite poorly in spite of its high growth rate. There is a close correspondence between CDIR and WDIR, though there are isolated cases of a state being much higher ranked on one than the other. There isn't much movement in the state rankings over the period of analysis.
Table 2. Targets and indicators of MDGs across Indian states, NFHS 2005-06
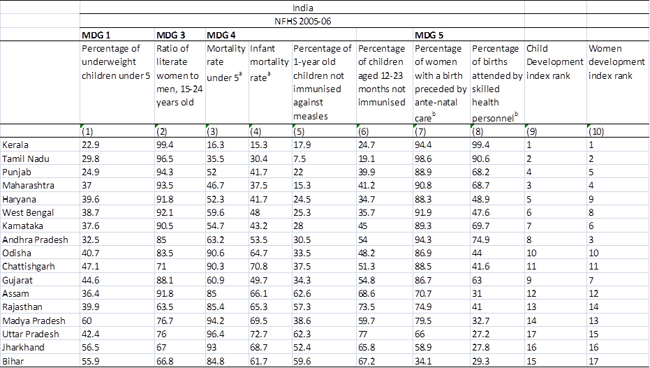
a Rate refers to 0-4 years preceding the survey; expressed in terms of deaths per 1,000 live births. b Rate refers to live births five years preceding the survey.
Table 3. Targets and indicators of MDGs across Indian states, RSOC 2013-14
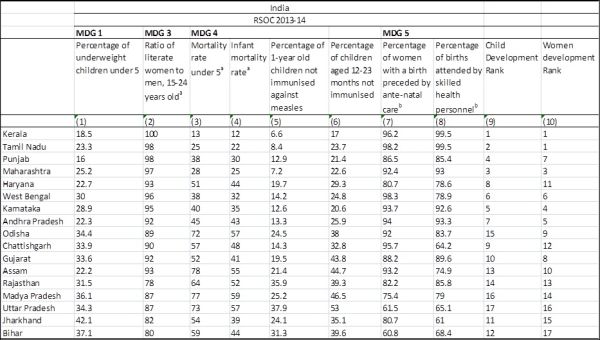
a Rates are based on India Census 2011. b Rate refers to live births three years preceding the survey.
Association between quality of governance and welfare outcomes
The strength of association between the quality of governance rank (GOVIR) and women and child welfare outcomes is presented in Table 4 below. Table 4 reports the rank correlation between alternative outcomes. While 'correlation' indicates the strength of association between two quantitative variables, 'rank correlation' indicates that association between the rankings based on two different outcomes. They provide evidence on the question: are the states that are higher ranked on one measure also higher ranked on another measure?
There is some evidence of positive association between governance and welfare outcomes, though not as strong as one might expect4. It is worth noting that the strength of the association between outcome and governance weakens to insignificance at the end of the period of analysis. This result is consistent with the India-Bangladesh comparison which showed that weak governance does not necessarily lead to inferior outcomes. The role of non-governmental organisations (NGOs) has been important in the case of Bangladesh, and that of education and social awareness in case of several of the higher ranked south Indian states. In both years (2005-06 and 2013-14), there is strong correlation between the state rankings on women and child welfare. Note, also, that the rank correlation between CDIs in the two years is 0.75, and that between the corresponding WDIs is 0.855. In other words, the state rankings have not changed significantly over this period.
Table 4.Rank correlation between quality of governance, child development and women development indices' rank
NFHS 2005-06
|
CDIR |
WDIR |
GOVIR |
|
CDIR |
1 |
||
|
WDIR |
0.7941* |
1 |
|
|
GOVIR |
0.4706* |
0.4706* |
1 |
RSOC 2013-14
|
|||
|
CDIR |
1 |
||
|
WDIR |
0.6864* |
1 |
|
|
GOVIR |
0.3088 |
0.3616 |
1 |
*Coefficients are significant at the 1% level.
Figures 1 and 2 present graphically the association between the state's rank on the quality of governance (y-axis) and the two development indices' rank (x-axis)6. The evidence supports positive association between the quality of governance and welfare outcomes.
Figure 1. Relationship between quality of governance and child development indices' rank across Indian states
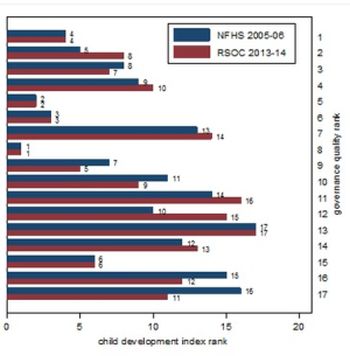
Source: Authors' computation based on data derived from NFHS 2005-06, RSOC 2013-14, and Mundle et al. (2012).
Figure 2. Relationship between quality of governance and women development indices' rank across Indian states
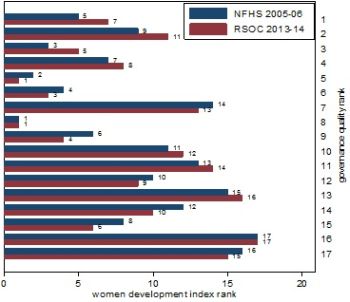
Source: Authors' computation based on data derived from NFHS 2005-06, RSOC 2013-14, India Census 2011, and Mundle et al. (2012).
Notes:
- Bangladesh being a neighbouring country of India with similar cultural features and a shared history has figured prominently in Drèze and Sen (2013) in a comparison of health outcomes with India.
- In Tables 1, 2 and 3, the 'ratio of literate women to men' is expressed by multiplying the original ratio by 100 such that a value of 100 represents the baseline case of complete parity between male and female literacy.
- A 'wasted child' refers to a child whose weight-for-age lies between -3 and -2 z-scores below the median of the World Health Organization (WHO) child growth standards. The 'z score' expresses the distance between an individual child´s weight and the average weight of comparable children in the reference population.
- We should stress that the positive association merely indicates that the quality of outcomes in a state moves in the same direction as the quality of governance in that state. This does not necessarily indicate a causal association. An investigation of a possible causal relationship is outside the scope of the present study.
- Both are highly significant at the 1% level.
- The quality of governance is ranked as follows: 1 - Punjab; 2 - Haryana; 3 - Andhra Pradesh; 4 - Gujarat; 5 - Tamil Nadu; 6 - Maharashtra; 7 - Rajasthan; 8 - Kerala; 9 - Karnataka; 10 - Chhattisgarh; 11 - Madhya Pradesh; 12 - Odisha; 13 - Uttar Pradesh; 14 - Assam; 15 - West Bengal; 16 - Bihar; 17 Jharkhand. Please see Mundle et al. (2012) for details.
Further Reading
- Drèze, J and A Sen (2013), An Uncertain Glory: India and its Contradictions, Princeton University Press, Princeton.
- Mundle, S, P Chakraborty, S Chowdhury and S Sikdar (2012), 'The Quality of Governance: How Have Indian States Performed?', NIPFP Working paper No. 2012-104.

Comments will be held for moderation. Your contact information will not be made public.