

 30 March, 2021


Concerns associated with the Covid-19 pandemic have led to new rationales of protectionism, with renewed emphasis on domestic production and sourcing. In this post, Assaf Razin compares the current economic crisis brought on by the pandemic to previous major economic crises, and examines what this could mean for the future of various aspects of globalisation.
In his 1919 book, The Economic Consequences of the Peace, John Maynard Keynes described the open borders of the then bygone first age of globalisation before the First World War: “The inhabitant of London could order by telephone, sipping his morning tea in bed, the various products of the whole earth, in such quantity as he might see fit, and reasonably expect their early delivery on his doorstep, he could at the same moment and by the same means adventure his wealth in the natural resources and new enterprises of any quarter of the world, [and] he could secure forthwith, if he wished it, cheap and comfortable means of transit to any country or climate without passport or other formality.” Globalisation did reverse its course in the second period, from the outbreak of the First World War in 1914 until the end of Second World War in 1945. The First World War led to prolonged economic dislocation, which included the withdrawal of Russia from world trade after the communist revolution in 1917, the Spanish flu pandemic in 1918 and 1919, monetary instability in the early 1920s, new immigration restrictions, the Great Depression starting in 1929, and a severe outbreak of protectionism in the 1930s. Today, health concerns are providing new rationales for protectionism, especially for international travel, medical gear and food, and a renewed emphasis on domestic sourcing.
Financial globalisation
Full international financial integration requires that in the long run (when prices adjust to various shocks and markets clear), there is arbitrage of real, exchange rate-adjusted, rate of return.
Figure 1. Cross-country standard deviation1 of real interest rates, adjusted for exchange rate changes
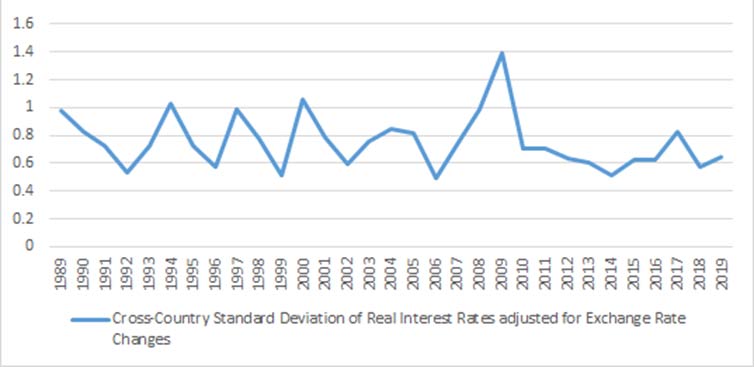
Source: Stats Bureau, Federal Reserve Economic Data (FRED), World Bank.
Note: Real-exchange-rate adjusted yields on three-month government bonds for Israel, Canada, Germany and the United Kingdom, and the yields on three-month US government bonds.
Figure 1 brings out strong evidence for financial integration among advanced economies. The figures show that the dispersion among countries in terms of the real interest rate, adjusted by real exchange rate changes, is narrowing over time.
Growth and global crises: A look at the history
Reinhart and Rogoff (2014), surveying centuries old crises, have discovered startling qualitative and quantitative parallels across a number of standard financial crisis indicators in 18 post-war banking crises. They found that banking crises were protracted (output declining for two years, on average); asset prices fell steeply, with housing plunging, and equity prices declining by 55% over 3.5 years. Unemployment rose by 7 percentage points over four years, while output fell by 9%.
Figure 2. Global growth: 1871-2020
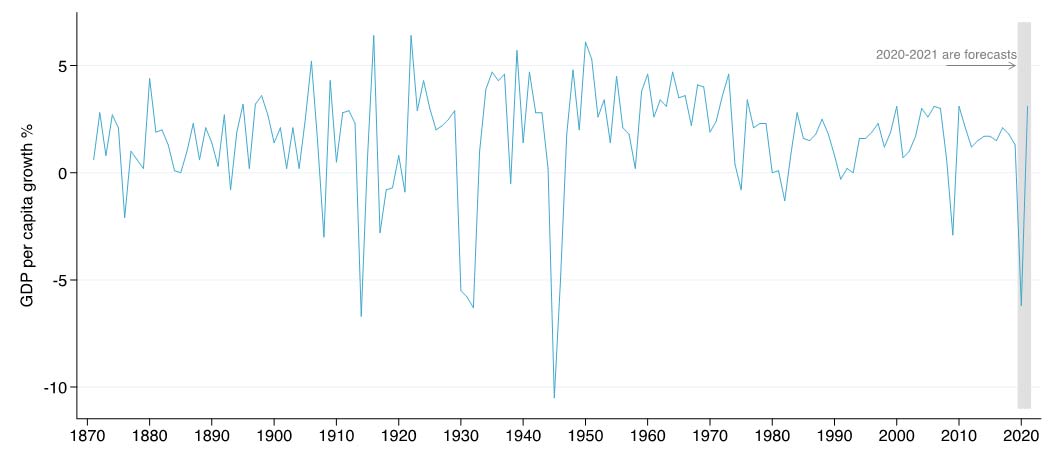
Since 1870, the global economy has experienced 14 global recessions. Current projections imply that the Covid-19 global recession will be the fourth deepest in this period and the most severe since the end of the Second World War.
Figure 3. US GDP (gross domestic product): Percentage change from previous quarter, 1950-2020 second quarter
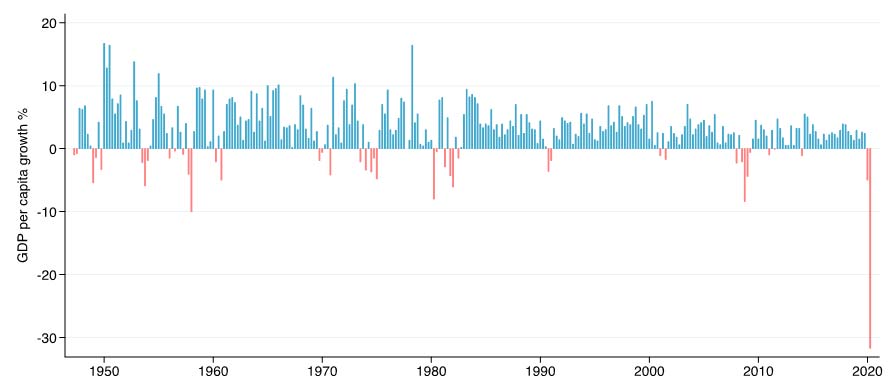
Source: US Bureau of Economic Analysis (2020).
Covid-19-induced lockdowns brought US unemployment rates to a historical high (see Figure 4). Exiting from the lockdown, US jobs grew by 4.8 million in June 2020. It was the second month of a strong job gain after the lockdown led to huge losses, when businesses laid off or furloughed2 tens of millions of workers as the pandemic put a large swath of economic activity on ice. The employment rebound came partly thanks to over US$500 billion in federal aid to small businesses offered on the condition that workers be retained, under the one-off Paycheck Protection Program.
Figure 4. US unemployment rate since 1948
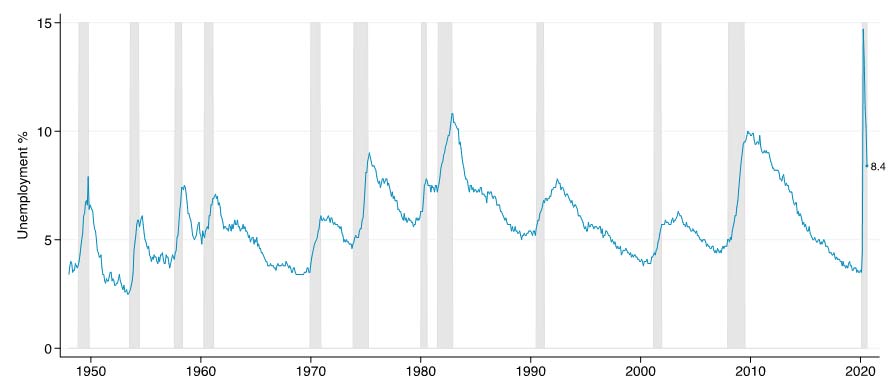
Source: Bureau of Labor Statistics and the Federal Reserve Economic Data.
Note: Unemployment rates are seasonally adjusted.
Figure 5 shows the index of world industrial production during the months following the onset of two crises: June 1929 for the Great Depression, and April 2008 for the Global Financial Crisis (GFC). It tracks pathways in the initial phases of several global crises.
Figure 5. World industrial production: Great Depression vs. Global Financial Crisis
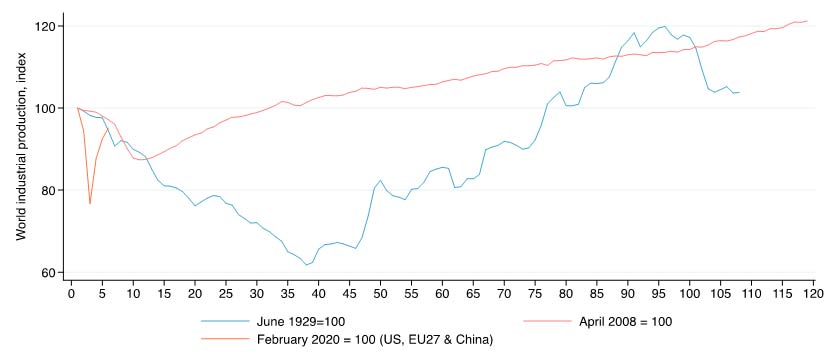
Sources: (i) Eichengreen and O’Rourke (2010), updated dataset. (ii) Recent data for US and EU are taken from the OECD (Organisation for Economic Co-operation and Development) (2020). (iii) The Chinese data are taken from the National Bureau of Statistics of China (Press release, August 2020).
Note: Indices are weighted by 2019 real GDP in ppp (purchasing power parity) from the OECD.
Eichengreen and O’Rourke (2010) observe that the downturns following the two financial crises, the Great Depression and the GFC, were initially very similar. The difference in the two occurred after about 10 months. During the GFC there was a relatively quick recovery after 10 months. Such a recovery did not occur during the Great Depression. The downturn continued for another 25 months before a more steady recovery set in.3
The first year of the 2008-2009 slump in industrial production (and, indeed in trade), was fully comparable to the first year of the Great Depression from 1929 to 1933. The GFC has some similarities with the Great Depression. It appears that in both cases the trigger is a credit crunch following a sudden burst of asset-price and credit bubbles. However, differences in financial institutions and policy reactions may explain the divergence of tracks after the initial stages. Recovery of world industrial production started much earlier in the GFC than in the Great Depression. Periods of depressed output are significantly shorter in the former than the latter, on account of different policy reactions and improved financial and budget institutions. This does not amount to a claim that economists understand how to employ fiscal policy and supplementary monetary instruments to optimally recover from or prevent future re-occurrences – given the often-destabilising expectations of the private sector, due to conflicting incentives, finance fragility, and politically gridlocked governments. It means that complacency based on incomplete knowledge of how the system works, is no longer tenable, and a re-assessment of past output, employment, and financial stabilising measures, is in order.
In comparing the GFC to the 2020 pandemic crisis (PC) there are few key differences. First, in terms of origin, the shock that triggered the GFC was internal to the economy. The crisis originated from the malfunctioning of the economy’s financial system. In contrast, the shock that started and prolonged the PC was external to the economy. The crisis is driven by epidemiology forces. Second, in terms of the magnitude of the initial shock, quantitatively, the first quarter’s decline since the beginning of the crisis – in terms of employment and output – is greater in the PC case, compared to the GFC. Third, in terms of length of recovery, the recovery period from the PC is expected to be short, once immunity from Coronavirus is discovered and large segments of the population are covered. In contrast, the recovery period in the GFC case was protracted.
The Covid-19 supply shock: Theoretical aspects
Guerrieri et al. (2020) demonstrate that in a general equilibrium setting, supply shocks such as Covid-19 can trigger changes in aggregate demand, larger than the shocks themselves. This is possible when supply shocks are concentrated in certain sectors – as they are during a shutdown in response to a pandemic. The fact that some goods are no longer available makes it less attractive to spend overall. An interpretation is that the shutdown increases the ‘shadow’ price of goods in the affected sectors, making total current consumption effectively more expensive and thus discouraging it. On the other hand, the unavailability of goods in some sectors can shift spending towards the other sectors, through a substitution channel. Whether or not full employment is maintained in the sectors not directly affected by the shutdown depends on the relative strength of these two effects. A supply shock in one sector can spill over into a demand shortage in another sector, which is amplified by incomplete markets.
Further, Guerrieri et al. (2020) show that in a situation where consumers are credit-constrained, contraction in employment in unaffected sectors becoming more likely. Intuitively, if workers in the affected sectors lose their jobs and income, their consumption drops significantly if they are credit-constrained. If workers in the unaffected sectors increase their consumption of the remaining goods sufficiently, aggregate demand will not contract. However, this requires a higher degree of substitution across sectors. If goods are not very close substitutes, aggregate demand contracts more than supply, and employment in the unaffected sectors falls.
Trade-globalisation in retreat
Trade creates more complex global inflation dynamics. The ICT (Information and Communications Technology) revolution has made a significant unbundling of production chains possible, and large wage differentials across countries have made doing so profitable. This generated vast new quantities of ‘supply chain trade’. Greater international economic interconnectedness over recent decades has been changing inflation dynamics (Carney 2017). The expansion of global value chains (GVCs), that is, cross-border trade in intermediate goods and services, is an important channel through which global economic slack influences domestic inflation. Auer et al. 2017 argue that as GVCs expand, direct and indirect competition among economies increases, making domestic inflation more sensitive to the global output gap. This can affect the trade-offs that central banks face when managing inflation. The ‘slope’ of the Phillips Curve4 may have changed (Razin 2018). There is evidence that global inflationary cycles that correspond with intensifying globalisation propagate common shocks via commodity, trade, and financial channels. Correlations of consumer price inflation are as elevated today as during the first oil shock and on the surface, we appear to be in the midst of a highly synchronised global rates cycle.
A measure of financial integration is how close is a country’s real interest (adjusted for real exchange rate evolution into the next period) to that of countries using different currencies and having different domestic price adjustments processes – in the long run, when domestic price adjustments to shocks takes place.
GVCs will likely undergo a drastic transformation in the decade ahead. The change will be driven by a push for greater supply chain resilience due to the pandemic.
One aspect of a lack of resilience of the last decades of globalisation is that GVCs were not sufficiently diversified and hence, highly vulnerable to shocks such as the pandemic or trade conflicts. Even prior to the Covid-19 pandemic, trade globalisation was challenged by a rising wave of populism spurred by economic discontent in Europe, the US, Latin America and elsewhere, and a trade war between the US and China. The GVCs could now be reshuffled or reduced. Whether they will be localised or regionalised, or whether the crisis will lead to the continuation of globalisation remains to be seen. A short period of economic recession seems unavoidable, but the question is whether Covid-19 crisis will structurally transform globalisation in the long term.
Global trade, measured by the ratio of world exports to world GDP, is a proxy for economic integration. Figure 6 indicates five periods of modern globalisation. The pandemic is expected to add further momentum to the de-globalisation trend. The forecasted diminished world trade in goods is shown in Figure 7.
Figure 6. Ratio of world exports to world GDP, 1870-2007
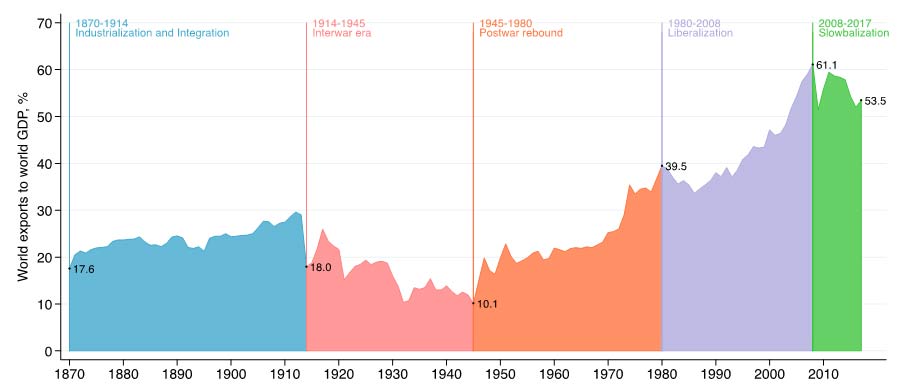
Figure 7. Volume of world merchandise trade
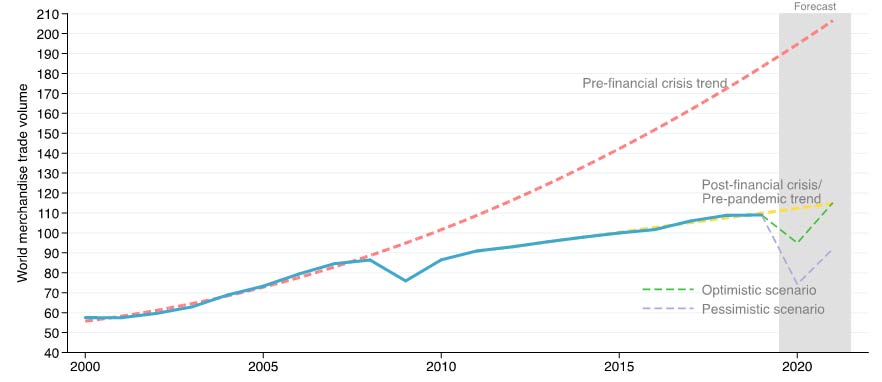
Source: World Trade Organization, Merchandise export volume indices.
The UNCTAD (United Nations Conference on Trade and Development)’s World Investment Report has monitored foreign direct investment (FDI) and the activities of multinational enterprises for 30 years, during which time international production saw two decades of rapid growth followed by a decade of stagnation. Flows of cross-border investment in physical productive assets stopped growing in the 2010s, the growth of trade slowed down and GVC trade declined (Figure 8).
Figure 8. Global value chain
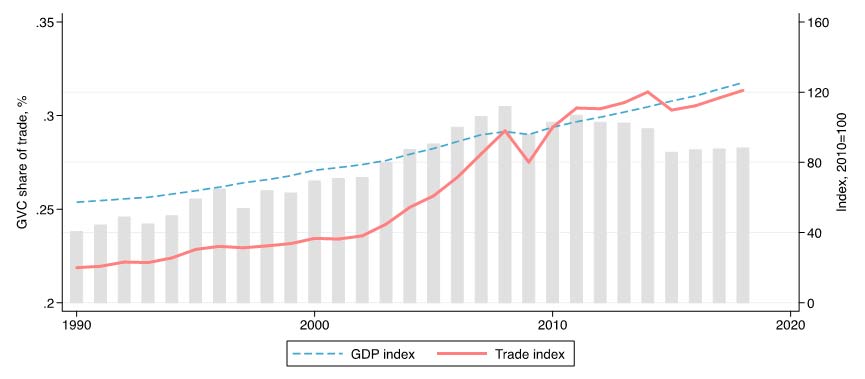
Sources: The Eora Global Supply Chain Database, UNCTAD (2020), and the World Bank (2020).
Note: (i) Trade is global exports of goods and services. (ii) GVC share of trade is proxied by the share of foreign value added in exports, based on the UNCTAD-Eora GVC database (Casella et al. 2019).
Conclusion
The pandemic-induced slump in economic activity is deep. Consumer spending, investment spending, and export demand have tumbled. Central banks tied down by zero interest rate are losing their most effective stabilisation policy instrument. Consequently, the burden falls on fiscal policy. When Covid-19 hit, supply chains and production were disrupted. But the bigger impact of the pandemic has been on the demand side – the desire to invest has plunged, while people across the richer parts of the world are now saving much of their income.
The pandemic has hit advanced economies at a time when the central banks’ policy rate was at the lower bound. This rendered monetary policy ineffective and weakened stimulus tools to assist the recovery. The Covid-19 shock has also had uneven effects on various income groups and monetary policy is not designed to deal with income gaps either. Therefore, fiscal policy has been the only means to deal with the recession and provide much-needed relief to some segments of society. The US has been outstanding in this respect.
US fiscal expansion to help the recovery has been unprecedented. The Recovery and Rescue bill (2021) to the tune of US$1.9 trillion in stimulus bill takes the total amount of pandemic-related spending passed since December 2021 to nearly US$3 trillion (14% of pre-crisis GDP), and the total amount paid out since the start of the crisis at the beginning of 2020 to about US$6 trillion.
Figure 9. Fiscal Support in the US, EU, and Japan as a percentage of GDP
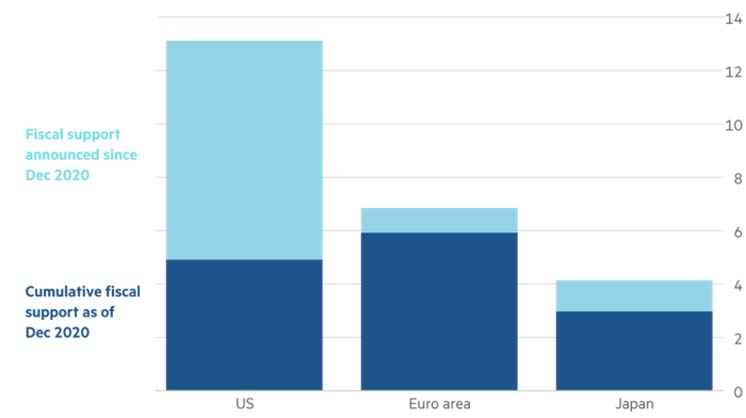
Source: OECD database.
Figure 9 demonstrates the big-relief packages among the major groups of developed economies. Note that in the US federal system, the fiscal union makes a significant difference in contrast to the EU, with its uncoordinated national fiscal policies. This reflects the greater risk-sharing embedded in a fiscal union of the scale of the US and a combination of greater macroeconomic coordination of national fiscal policies.
In the longer term there is a risk that younger students from poorer backgrounds will struggle to catch up after an extensive period of being out of school due to lockdowns and other disruptions. Education disruptions by the pandemic distorts the development trajectory of children, social mobility declines, lowering productivity and raising inequality.
I4I is now on Telegram. Please click here (@Ideas4India) to subscribe to our channel for quick updates on our content.
Notes:
- Standard deviation is a measure that is used to quantify the amount of variation or dispersion of a set of values from the average of that set.
- A furlough is an involuntary, temporary leave of absence with workers being able to retain their jobs at the end of the period of leave.
- See also De-Grauwe and Ji (2020).
- The Phillips curve represents the relationship between inflation and unemployment ratesin an economy. The two variables are expected to have an inverse relationship. The slope of the curve indicates the responsiveness of inflation to unemployment.
Further Reading
- Auer, R, C Borio, and A Filardo (2017), ‘The globalization of inflation: the growing importance of global value chains’, BIS Working Papers.
- Carney, M (2015), ‘How is inflation affected by globalisation?’, World Economic Forum.
- Casella, B, R Bolwijn, D Moran and K Kanemoto (2019), “Improving the analysis of global value chains: the UNCTAD-Eora Database”, UNCTAD Transnational Corporations.
- Chetty, R, JN Friedman, N Hendren, M Stepner and TOI Team (2020), ‘How did covid-19 and stabilization policies affect spending and employment? a new real-time economic tracker based on private sector data’, NBER Working Paper w27431.
- De-Grauwe, P and Y Ji (2020), ‘A tale of three depressions’, VoxEU & CEPR, 24 September.
- Eichengreen, B and K O’Rourke (2010), ‘A tale of two depressions: What do the new data tell us? February 2010 update’, VoxEU & CEPR, 8 March.
- Guerrieri, V, G Lorenzoni, L Straub and I Werning (2020), ‘Macroeconomic implications of covid-19: Can negative supply shocks cause demand shortages?’, NBER Working Paper w26918.
- Razin, A (2018), Israel and the world economy: the power of globalisation, The MIT Press, Cambridge, Massachusetts.
- Reinhart, CM and KS Rogoff (2014), ‘Recovery from financial crises: Evidence from 100 episodes’, NBER Working Paper w19823.
- UNCTAD (2020), ‘World Investment Report 2020: International Production Beyond the Pandemic’, New York and Geneva.
- World Bank (2020), Global Economic Prospects.
- Zhan, J, R Bolwijn, B Casella and AU Santos-Paulino (2020), ‘Global value chain transformation to 2030: Overall direction and policy implications’, VoxEU & CEPR, 13 August.

Comments will be held for moderation. Your contact information will not be made public.